
- Zcash’s broken ascending trendline gives the sellers the advantage and $1037 will become a new support level.
- Historical liquidation peaks highlight how leveraged trading magnified ZEC surges and reversals from May to October.
- The marked trading setup places its downside target at $858, while a deeper decline towards $800 remains possible.
ZEC selling pressure has returned following a failed recovery, with traders watching broken support, liquidation activity and lower price levels for further direction.
ZEC Breakdown Gives Sellers the Upper Hand
Kaz The Shadow shared the recent breakdown, describing the strong sell-off as the movement anticipated by his short position. The trader also mentioned waiting for a possible retest before increasing exposure.
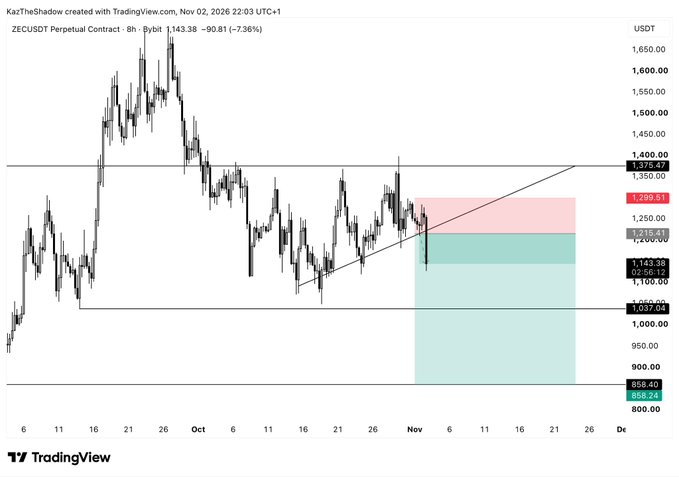
Zcash has lost the ascending trendline that supported its October recovery. The eight-hour chart shows sellers breaking below this rising support. The move followed repeated failures near the $1,375.47 resistance level.
As of this writing, the market price of ZEC is $1,204.92. In the previous 24 hours the token has fallen 3.36% and 5.69% over the past 7 days. Trading volume is approximately $993.3 million per day.
Before the breakdown, buyers had defended successive higher lows throughout October. That structure eventually weakened as sellers returned near resistance. The resulting decline pushed ZEC beneath the rising trendline.
Liquidation History Shows Changing Market Conditions
The perpetual liquidation chart provides a longer view of ZEC trading activity. Between May and October, sharp price movements produced substantial liquidation spikes. June recorded some of the largest events, approaching $67.2 million.
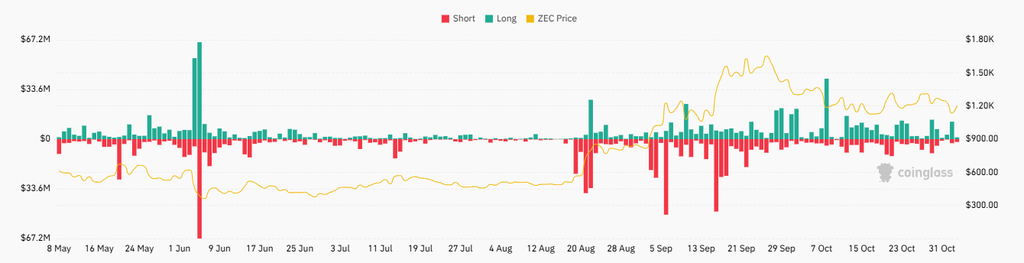
After June’s volatility, liquidation activity became considerably quieter. From mid-June through early August, ZEC traded within a narrower range. The corresponding liquidation bars were generally smaller during this period.

Activity increased again during the second half of August. ZEC climbed beyond $900 as leveraged positions faced growing pressure. Both long and short liquidation bars became more pronounced.
September brought another sharp increase in trading activity. ZEC advanced beyond $1,500, accompanied by several large red liquidation spikes. Green bars also expanded during September and October, showing pressure on leveraged long positions.
$1,037 Support Comes Into Focus as Traders Watch $858
The trading chart marks $1,037.04 as important horizontal support. This level sits below the breakdown area and represents the next downside reference. A sustained move beneath it could expose ZEC to further losses.
The proposed short setup has an entry reference of around $1,215.41. The stop loss is very close to $1,299.51 and is above the broken structure. The marked take-profit level stands around $858.40.
A recovery towards the broken trendline could provide another trading opportunity. However, failure to reclaim that area would leave sellers with the advantage. A stronger move above former support could challenge the bearish setup.
The liquidation history also warns against expecting a straight decline. Forced position closures can produce abrupt movements in either direction. Buyers could emerge around previous support, while short-covering may fuel temporary rebounds.
The $800 expectation extends below the chart’s marked target. Reaching that level would require ZEC to break through several intervening price areas. For now, $1,037, $858 and the former trendline remain important levels to watch.