- SHIB resilience remains visible as recent recovery and exchange activity point to sustained market participation.
- Upbit leads displayed SHIB volume, while Binance and Coinbase also recorded notable trading activity.
- Positive exchange inflows remain concentrated across major platforms as traders monitor renewed market strength.
With the larger cryptocurrency market showing signs of fragility, a recent drop in investor sentiment appears to be masking trading activity on SHIB.
Exchange Activity Shows Concentrated Market Participation
In a recent post, $SHIB Bezos described SHIB as demonstrating notable relative strength during market weakness. The public narrative was that the token was becoming a stock in its own right and not part of the overall market. The article was about its resistance in selling-off and highlighted that SHIB was now back in the spotlight of the market.
The image and brand are reinforced in the accompanying graphic using strength-based imagery. The muscular figure is wearing a vest with the Shiba logo, and it has the tag SHIB underneath. Its prominent “pump it!” message further connects physical strength with market momentum.
The latest exchange heatmap provides additional context through concentrated trading activity. Upbit records the largest displayed trading volume at approximately $151,000. Binance follows with $51,680, while OKX records roughly $30,710.
Coinbase reports around $13,060 in displayed volume during the measured period. Bybit follows closely with approximately $12,530 in activity. Below are some of the top exchanges that have participated in the data.
Net Inflows Reveal Differences Across Major Exchanges
The net inflow heatmap presents a similar concentration across major exchanges. Upbit records approximately $23,040 in displayed net inflows. Binance follows with roughly $12,990, while Coinbase reaches approximately $9,530.
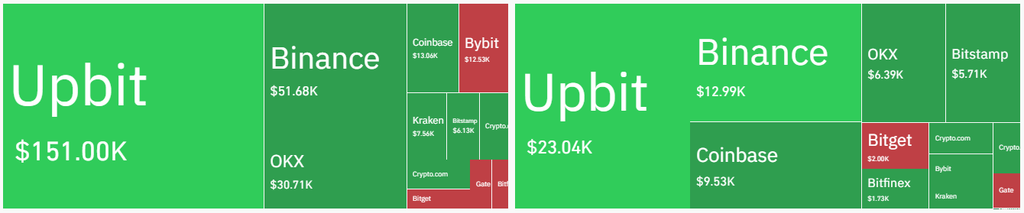
OKX records approximately $6,390 in net inflows during the measured period. Bitstamp follows with around $5,710 in positive net inflows. Several smaller exchanges display considerably lower inflow levels.
Positive net inflows indicate that more funds entered exchanges during measurement. However, inflows alone cannot establish whether traders intend to sell. Subsequent trading activity determines how those balances affect immediate market pressure.

The distribution nevertheless provides useful information about exchange-level liquidity. Upbit leads both displayed volume and net inflows across the heatmaps. Binance also maintains substantial participation across both measurements, reinforcing its position among active venues.
Recent Recovery Shapes the Relative Strength Discussion
The relative strength argument also connects with SHIB’s recent price recovery. The supplied historical data places the token near $0.00000494 on September 15. By October 1, SHIB had recovered toward approximately $0.00000579.
Recent market information also showed renewed trading activity alongside broader cryptocurrency gains. SHIB reportedly advanced alongside Bitcoin and Dogecoin during the latest market recovery. Its performance was described as slightly stronger than Bitcoin’s and ahead of Dogecoin’s.
However, stronger performance during one market advance does not establish independence. Liquidity and investor sentiment continue to sway the value of cryptocurrency assets. Therefore, relative strength is vital with regard to sustained performance under varying conditions.
The latest exchange figures provide another perspective on this developing market narrative. SHIB trades around $0.00000567, reflecting a reported decline of 3.91%. Futures open interest stands near $65.44 million, while spot volume reaches $26.49 million.
Futures volume is considerably higher, reaching approximately $48.18 million. This difference indicates substantial derivatives participation alongside ongoing spot market activity. These numbers are indicative of an active market but do not necessarily reflect conviction in the direction.
The big problem now is if recent resilience can continue while selling pressures resume. Holding recovered levels would provide further evidence of sustained market demand. Conversely, weakening prices could challenge the current relative strength narrative.