
- SHIB holds support near yearly lows as declining resistance compresses price, leaving traders watching liquidity and momentum closely.
- Large ownership and market capitalization provide an established base, but stronger liquidity remains essential for sustained recovery.
- Renewed meme liquidity could lift demand, yet the chart still requires a breakout above falling resistance before confirming momentum.
SHIB remains near a key support zone as falling resistance compresses price, leaving traders focused on volume and momentum for the next directional move after months of weakness.
Support Holds After Extended Selling
The SHIBMortal post describes the token as potentially waking up near its lows. The post cites 3.07 million holders and a $2.66 billion market capitalization. It also links renewed meme liquidity with possible demand returning across established meme assets.
The daily chart shows a prolonged decline from levels above $0.00000900. Sellers maintained control through successive lower highs and lower lows. Price did start to level off, however, at the $0.00000400 area.
The chart depicts the price of the token at the near $0.00000447. The latest session opened near $0.00000450 before slipping modestly lower. Price remains close to the established $0.00000430–$0.00000440 support area.
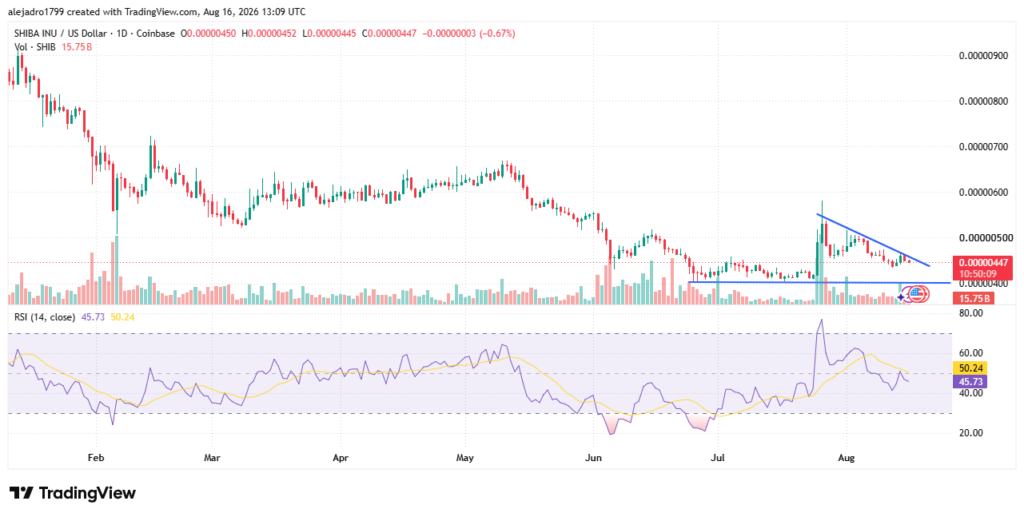
That support has become important after several unsuccessful recovery attempts. Recent candles repeatedly returned toward the same lower boundary. Buyers have therefore maintained a defensive position despite limited upward momentum.
Falling Trendline Limits Recovery Attempts
A descending blue trendline now connects several recent lower highs. This structure developed after the late-July recovery pushed above $0.00000500. That breakout attempt attracted higher volume but failed to produce sustained follow-through.
The rejection sent the price back toward the lower trading range. Since then, rallies have remained below the descending resistance line. This pattern keeps the short-term structure tilted toward continued consolidation.

A decisive breakout above that trendline could change the immediate technical picture. Stronger volume would make such a move more credible than a low-volume spike. The next resistance area would then develop around $0.00000500-$0.00000530.
Conversely, continued rejection could place renewed pressure on support. A clean break below $0.00000430 would weaken the current base. Sellers could then attempt to extend the broader decline toward lower levels.
RSI Signals Cautious Market Momentum
The 14-day RSI currently stands near 45.73, according to the displayed chart. Its moving average remains higher near 50.24, keeping momentum below a stronger bullish threshold. Still, the indicator has not entered oversold territory.
The RSI structure suggests neither buyers nor sellers have gained decisive control. Earlier weakness pushed the indicator toward oversold conditions several times. Recent stabilization has instead produced a more balanced momentum reading.
Trading volume also supports the cautious interpretation of current price action. Activity increased sharply during the late-July recovery attempt. However, volume declined as price moved sideways beneath falling resistance.
The broader market case also depends on renewed speculative liquidity. SHIBMortal points to the large holder base as an existing source of market participation. Yet holder numbers alone cannot confirm accumulation or guarantee stronger future demand.
The setup as of writing, therefore remains technically compressed rather than decisively bullish. Buyers need a sustained breakout above descending resistance with stronger participation. Sellers, meanwhile, need a clear loss of support to regain directional control.
Until either event occurs, the market remains caught between declining resistance and established support. The next high-volume move should provide clearer evidence of the emerging trend. For now, the chart shows stabilization after weakness, but no confirmed reversal.