- ZEC is testing a key descending trendline near $410, signaling early signs of momentum shift.
- RSI recovery from the 40 zone suggests fading selling pressure and growing buyer interest.
- Sustaining above $410 could open the door toward $430 and $455 resistance levels.
Zcash (ZEC) is nearing a highly important technical area where a significant downward trendline is determining a price action. Strength above this level will be watched keenly by the market to determine whether it can affirm a short-term break out and rejuvenate an upward movement.
Trendline Pressure Eases as Buyers Step In
Market watchers have turned their attention to ZEC as the price begins to challenge a descending trendline that has capped rallies for several sessions. The setup is gaining traction after Alpha Crypto Signal (@alphacryptosign) remarked, “Above the trendline is where the real move starts. As long as $ZEC holds this level, the upside remains the game.”
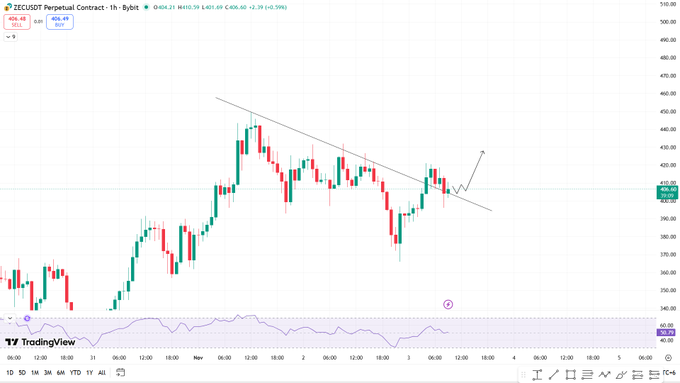
The one-hour chart reflects this growing tension. ZEC has been moving in a tightening structure beneath resistance from the $440 zone, with each rejection reinforcing that line’s influence. However, this week the price action presents an indication of an evident breakthrough as it lingers within the range of $410–$415 zone, which may be used to outline the next directional flow.
When bulls can control a strong close above this point the buying volume can pick up. Momentum traders are already positioning for a potential upside leg, eyeing the early breakout as a shift in control from sellers to buyers.
Structure and Momentum Analysis
ZEC’s recent price behavior points toward gradual strength building from its higher low near $395. This base level has been tested several times, suggesting the market is forming an accumulation zone. The repeated defense of this support gives the breakout attempt stronger footing.
The Relative Strength Index (RSI) on the one-hour chart adds to the bullish case. After dipping toward 40 earlier, it has recovered toward neutral territory. When it moves beyond 60, it would show that the momentum is shifting back to the buyers and the probability of going through would improve.
There is now resistance at around $430, and a more mature supply region of around $455-$460. A sustained move through those levels could confirm the end of the recent downtrend. On the other hand, failure to maintain above the trendline may trigger a pullback to $395 or even the $375–$380 zone — where short-term liquidity tends to cluster.
ZEC Market Data Signals Mixed Sentiment
CoinGecko statistics as of writing, show that ZEC is trading at approximately $382.20 which is a 6.7% decline over the last 24 hours. The price of the token has ranged between 369.91 and 423.62 which shows that it is still volatile. The market capitalization currently stands at $6.29 billion, supported by an active $964.45 million in daily trading volume.
The circulating supply of 16.36 million ZEC out of a 21 million max cap continues to reinforce Zcash’s scarcity narrative. The fully diluted valuation (FDV) nearly matches the current market cap, indicating limited inflation risk ahead. This balance between circulating and total supply often appeals to long-term investors focused on predictable issuance.
Despite the current dip, traders are monitoring whether ZEC can stabilize above $410. A breakout supported by rising volume could confirm renewed market confidence and signal the start of a short-term trend reversal. As Alpha Crypto Signal remarked, the key remains simple — “Above the trendline is where the real move starts.”


