
- ZEC shows crowded long clusters under price as liquidation risk builds across leveraged positions.
- Netflows reflect renewed outflows after heavy mid-November inflows as price stabilizes.
- ZEC reacts to higher participation with stronger volatility driven by liquidity pockets.
ZEC trades near a key liquidity zone as traders assess fresh liquidation clusters and shifting exchange flows. Trading activity rises while long exposure builds under price, creating sensitive market conditions.
Crowded Long Clusters Form Beneath Current Market Levels
ZEC shows a dense liquidation band below current price, creating tension across leveraged positions. The cluster stretches from $360 to $380, forming the thickest concentration on the map. That zone reflects aggressive long exposure from traders expecting a continuation.
In a recent update, Ardi noted that crowded long bands tend to attract price when volatility rises. He described this setup as late-cycle positioning where traders scale up quickly after a brief recovery. This behavior often precedes sharp moves as markets react to excess leverage.
The liquidation map shows limited resistance above price with a clearer path toward the $420 region. However, markets rarely move into upper liquidity pockets without clearing nearby forced orders. This dynamic keeps downside pressure active despite broader interest.
Price Reaction Strengthens After a Sharp Rise Toward $420
ZEC as of writing posted a strong 24-hour gain to $420.17, supported by higher trading volume and improving sentiment. The spike followed a breakout from the $370 to $380 consolidation band. That zone served as a base where buyers regained control after earlier weakness.
Volume exceeded $1.36 billion over the same period, marking a 62% rise. The pair traded with higher momentum as market-cap levels moved toward $6.9 billion. That combination pointed to growing participation from both spot buyers and short-term traders.
Price structure showed a steady sequence of higher lows while buyers defended key intraday levels. This trend developed as ZEC reacted to a new dynamic-fee update discussed in recent community posts. That development drew additional attention to network activity.
Netflow Data Shows a Full Cycle of Accumulation and Repositioning
Exchange netflows reveal a broader pattern that shaped recent volatility. Strong outflows appeared in early October as traders moved assets away from exchanges. That period aligned with ZEC’s sharp climb through late September and early October.
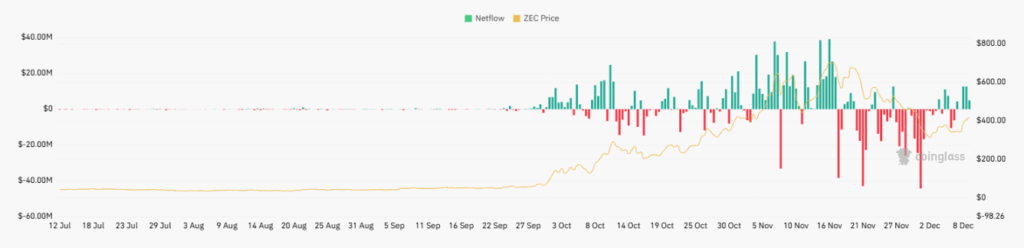
By mid-November, the pattern reversed with large inflows returning to exchanges. Those inflows signaled repositioning as prices reached local highs. Some moves reached tens of millions, suggesting larger traders were preparing for renewed activity.
From late November onward, inflows continued but price stabilized above mid-range levels. Recent sessions show renewed outflows as ZEC attempts to rebuild the structure. If this trend continues, the market may attempt a move toward cleaner liquidity zones.


