- XRP faces pressure around a key support zone after retreating from its recent high and testing lower Fibonacci levels.
- Bitcoin and Ethereum saw the highest withdrawals in Crypto investment products as $575.91 million were pulled out in a week.
- A move above $1.73 could open a path toward $2.95, while a drop below $1.11 would weaken the bullish wave count.
The Elliott Wave pattern and recent ETF withdrawals are putting XRP’s price to a test near $1.30, with traders watching the developments closely.
XRP Tests Support Under the Elliott Wave Count
More Crypto Online (@Morecryptoonl) says XRP needs a firm reaction from support to confirm a possible wave 1–2 pattern. The chart exhibits a recovery from the $1.00 area towards $1.50 before a withdrawal. The ongoing pullback could be a correction, but for now it doesn’t look like it.
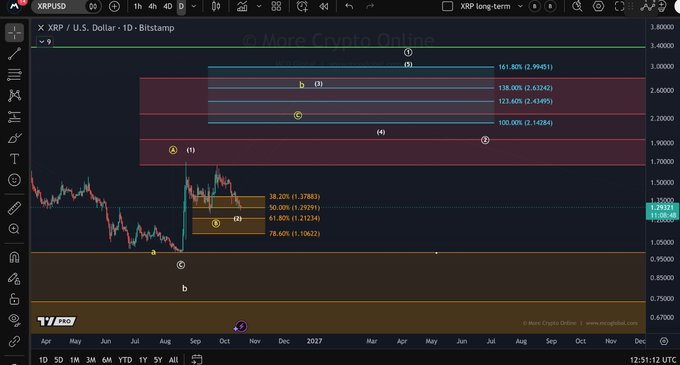
Market data provided shows XRP at $1.31, 1.16% up on a 24-hour time frame. That was a daily gain, but the token is still down 6.96% over seven days. Its 24-hour trading volume is reported to be at around $1.43 billion.
The chart marks Fibonacci retracement levels near $1.38, $1.30, $1.22, and $1.11. XRP is trading around the $1.30 level at the 50% retracement level. Buyers need to defend this area to keep the proposed wave structure intact.
A rebound above recent swing highs would strengthen the bullish reading. However, a fall through $1.22 and $1.11 would weaken the setup. The recent low near $1.00 would then become an important level to watch.
Crypto ETF Outflows Reach $575.91 Million
Spot ETFs tracking Bitcoin, Ethereum, Solana and XRP all saw net withdrawals last week, according to Crypto_Paykash. Ethereum led the pack with $319.97 million, followed by Bitcoin at $228.58 million. Solana funds saw $25.52 million in losses and XRP products saw $1.84 million in withdrawals.
The total outflows for the four assets were $575.91 million. Of that, $548.55 million was in Bitcoin and Ethereum. The figures reveal that withdrawals were largely targeted at funds associated with the two biggest cryptocurrencies.
ETF flows represent the flow of money into or out of investment products. Withdrawals can be interpreted as profit taking, portfolio adjustments or a diminishing appetite for risk. The weekly results provide no indication of what caused each investor to trade.

XRP’s smaller outflow does not prove that buyers are accumulating the token elsewhere. The data covers ETF products, not all activity across cryptocurrency exchanges. Spot demand and derivatives trading can also affect market prices.
XRP Needs to Clear Resistance Before Higher Targets
The Elliott Wave chart places an important resistance area around $1.70, with $1.73 identified as the breakout level. A sustained move above $1.73 would strengthen the proposed bullish count. Failure to break through could leave XRP exposed to another pullback.
Higher Fibonacci extensions appear near $2.43, $2.63, and $2.95. These levels could become relevant if XRP clears the nearer resistance zones. The chart also marks $3.40 as a more distant target, requiring a much larger advance.
The downside levels remain important while XRP trades near support. A break below $1.22 could expose $1.11, where the proposed pattern would face further pressure. Losing that level could bring the recent low near $1.00 back into view.
ETF withdrawals add another factor for traders to monitor. Continued outflows would show that money is still leaving the tracked investment products. If the flow moves back into the positive, it will be a change, but it will not mean that the price of XRP will go up.
So far, XRP is still working in the $1.30 zone and requires to establish resistance in the vicinity. A break from $1.73 would help bulls, while a break below $1.11 would weigh on bulls. The 2.43 – 2.95 range is a potential, not a definite outcome.