
- SOL charts a textbook V-shaped recovery with higher lows and steep upward momentum.
- Resistance at $236 remains crucial for continuation toward cycle highs.
- Market cap above $125B and liquidity near $8.8B confirm strong participation.
SOL continues to demonstrate strength with a chart pattern that reflects a classic V-shaped recovery. The asset shows a firm rebound from recent lows, building momentum toward prior cycle highs and positioning itself for potential future advances.

Structure and Momentum
Market observers note that the recovery has not developed by accident but through consistent structure. Gordon (@AltcoinGordon) described the move as a roadmap toward higher valuations, citing the clarity of the recovery. The chart records a sharp drop followed by a steady base, which transitioned into a disciplined uptrend.
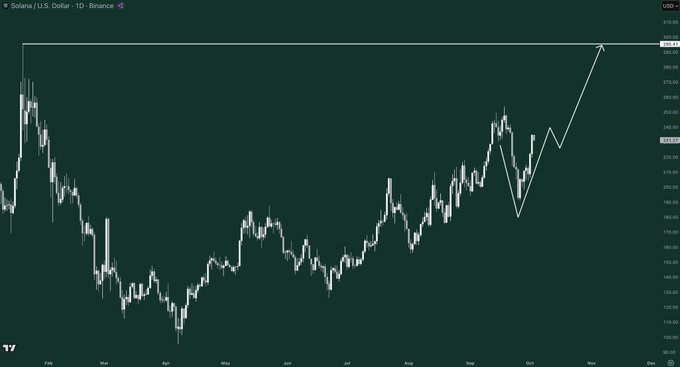
This progression is visible in a sequence of higher lows and higher highs across multiple months. Recent advances have been steep, suggesting strong buyer participation and reduced seller control. The visible V pattern signals a rapid shift in market preference, moving decisively from distribution to accumulation.
Momentum is also evident in the speed of the rebound and the relatively shallow corrective movements that followed. These pullbacks appear more as consolidation phases than trend reversals, adding strength to the overall setup.
Key Levels and Market Data
The price movement indicates a tight yet vibrant trading range of 228.01 -236.41 over the last 24 hours. At the time of writing, SOL trades near $229.54, recording a 0.2% daily gain. The retracement from $236 confirms resistance at that level, while support at $228 remains intact.
Market capitalization stands at $125.16 billion, affirming its large-cap position within the industry. A fully diluted valuation of $140.26 billion suggests a relatively balanced ratio between circulating and total supply. With 545.2 million tokens in circulation, supply distribution is nearly 89%, managing dilution risk.
Daily trading volume is $8.8 billion, reflecting robust liquidity. This depth allows efficient trade execution while validating price levels as supported by broad participation. Liquidity at this scale reduces volatility spikes caused by thin markets, strengthening the technical structure further.
Recovery Quality and Risk Considerations
The recovery shows conviction and structure. Gordon emphasized that such V-shaped rebounds rarely occur without sustained participation. A combination of gradual accumulation, an impulsive rally, and shallow corrections marks this chart as technically reliable.
Resistance at the prior cycle high forms the immediate target. A daily close above this point would confirm the recovery’s strength. A retest that flips resistance into support could pave the way for new highs, according to Gordon.
Risk remains in the event of failure at the breakout zone. Traders may look at swing lows for controlled stop placements. With volume as a confirming factor, sustained demand is required for continuation toward broader targets. The pathway to $1,000, while ambitious, relies on repeated breakout validations and broader market support.


