
- TRUMP token confirms breakout after months of trading within a descending wedge formation.
- Volume surge signals active participation as traders reenter amid bullish sentiment.
- Technical targets suggest potential continuation toward $18–$20 if momentum holds.
TRUMP token is exhibiting a strong technical recovery following months of downward pressure. Market data reflects a confirmed breakout pattern, supported by increasing trading activity and renewed optimism among traders anticipating continued upward movement.
Breakout Confirms Structural Reversal
The TRUMP/USDT daily chart confirms a decisive breakout from a long-standing falling wedge structure. This technical setup typically signals diminishing selling pressure and potential for an upside reversal once upper resistance gives way. The breakout now marks the first meaningful shift in direction after an extended bearish phase.
Captain Faibik shared that “$TRUMP finally started pumping,” referring to this breakout setup. The daily candle that pierced through resistance appeared robust, suggesting genuine momentum rather than a temporary surge. Traders observing daily closes above the wedge see this as confirmation that bullish control is emerging after months of consolidation.

Measured projections from the pattern point toward an aggressive upside of nearly 175% from the breakout level. If sustained, this move could place the next resistance near the $18–$20 range, aligning with previous liquidity areas where traders might begin scaling out.
Volume Expansion Signals Renewed Participation
Volume analysis supports the structural shift in sentiment. Trading activity spiked sharply during the breakout, reaching $1.82 billion in 24-hour turnover — an increase of roughly 148%. The ratio of volume to market cap now exceeds 100%, a level that reflects heavy participation and liquidity inflow.
This type of price growth with volume suggests that new capital has come into the market which is one of the elements of a sustainable momentum. The market cap of the token increased to 1.67 billion as the buying pressure continued to increase and the fully diluted value was around 8.35 billion. This shows strong short-term demand but leaves room for potential dilution as locked tokens become active.
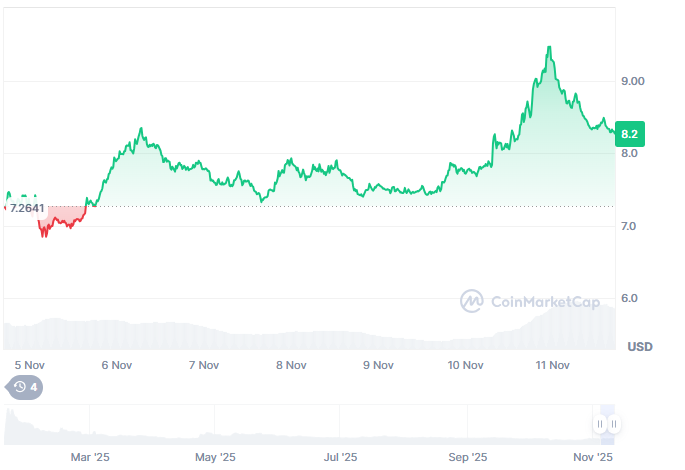
The TRUMP chart reveals that the price action is at its maximum point of approximately $9.50 then it subsides to $8.36. Though this has been reversed, the pullback seems to be in order and the volume of lighter selling is greater, which suggests that traders are consolidating instead of leaving at a high level.
Market Structure and Sentiment Outlook
TRUMP has an active supply of 199.99 million tokens out of its total supply of 999.99 million tokens which is approximately one-fifth of the total supply. Such a supply force establishes a balance between possible liquidity and potential release in the future, affecting the volatility and long-term stability.
According to social data, there is an excess of more than 632,000 holders indicating a robust retail-based community that is common in meme-based assets. The direction of the price corresponds to a bigger picture of optimism in speculative altcoins that are recovering after years of corrections. Many traders view TRUMP’s rebound as part of an early rotation toward higher-risk assets.
Technical levels to watch include immediate support around $8.00–$8.15 and resistance near $8.80–$9.50. A retest of the breakout zone between $7.00–$7.50 may serve as a confirmation level before further continuation. If this structure remains intact, TRUMP could maintain upward momentum into the next trading sessions, validating the current bullish setup.


