
- SUI’s four-hour SuperTrend indicator signals a possible recovery after its retreat from $1.30 toward the $1.00 support region.
- SUI appreciated by 2.18% over the last 24 hours, with volume up 21.71%, showing more market interest in recovery.
- Resistance is key between $1.12 and $1.14, and $1.10 and $1.00 offer important support levels.
SUI is showing renewed buying activity as a fresh technical signal emerges, while intraday trading reveals resistance that could determine its next direction.
SuperTrend Signal Draws Attention to SUI’s Recovery
Ali Charts reported a new SuperTrend buy signal on SUI’s four-hour chart. This suggests that a new price rally may form after the recent price pullback. A previous comparable signal preceded a reported rally of 77.53%, although history cannot guarantee repetition.
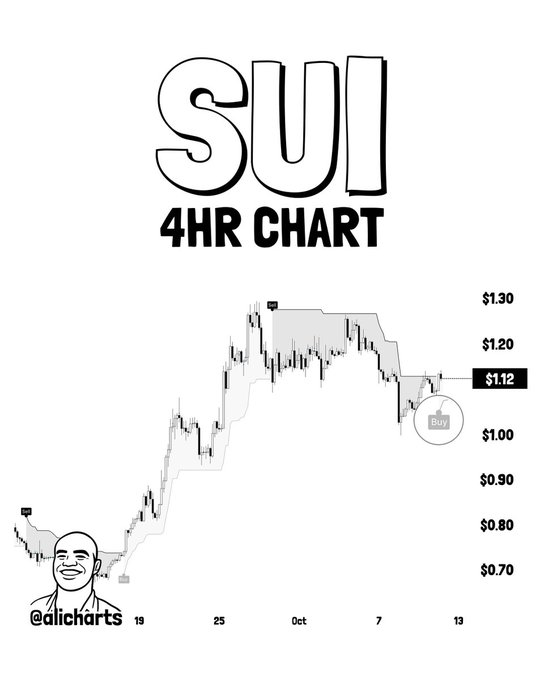
The four-hour chart shows a recovery from the 0.70–0.80 region. Buyers subsequently pushed prices above $0.90 and reclaimed the psychological $1.00 level. But momentum keeps heading towards $1.20, which is met by resistance around 1.25–1.30.
But sellers took over near those peaks and caused the subsequent pullback. The price dropped towards the $1.10 support level, briefly touching the $1.00 support level. The latest recovery suggests that buyers are attempting to rebuild momentum after that decline.
The SuperTrend indicator uses volatility-based calculations to identify potential changes in market direction. It has just issued a buy signal, indicating positive conditions, but it will need continued price action to confirm. Traders are therefore watching whether the developing recovery can overcome nearby resistance.
Intraday Trading Shows Stronger Participation
The latest intraday chart places SUI around $1.11, following a 2.18% daily gain. Prices initially dropped toward $1.09 before recovering above $1.10. The subsequent advance carried the asset toward $1.14 during the session.
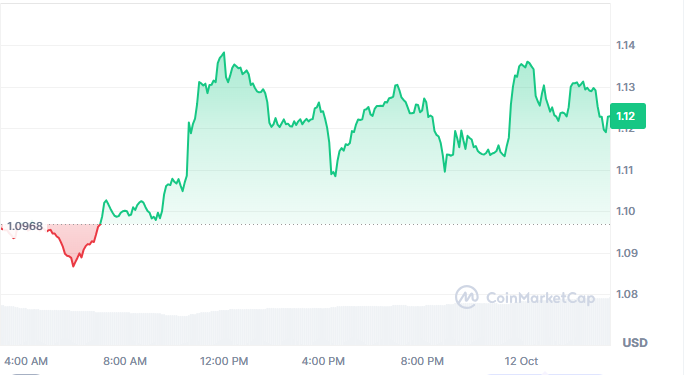
That rally encountered selling pressure as prices approached the upper end of the displayed range. SUI retreated toward $1.12 before experiencing another decline during afternoon trading. Buyers responded again, helping the asset recover before its latest pullback.

The 1.12–1.13 region now represents immediate resistance on the intraday chart. A sustained move above this zone could allow another test of $1.14. However, repeated rejection would indicate that sellers remain active around these levels.
Trading volume increased 21.71% over 24 hours, according to the supplied market data. Higher volume alongside positive price performance suggests increased participation during the recovery. Nevertheless, volume alone cannot establish whether buying pressure will continue.
Support and Resistance Define the Next Move
The $1.10 level serves as an immediate reference point for the developing recovery. Holding above it could provide a base for another attempt at 1.12–1.14. If a breakout occurs, it would enhance the short-term technical picture and clear the $1.20 resistance level.
The previous 1.25-1.30 area is another significant resistance level. Previously, sellers broke out from there and reversed the trend of the previous days. It would take time and momentum for buyers to come through and take back that area.
The negative side of the picture, $1.00 is an important psychological support level. If selling pressure continues to increase, there may be a break below it exposing $0.90. Such a drop would take the bounce under a strain and put the bull market thesis to the test.
The previous 77.53% advance provides historical context for the latest SuperTrend signal. However, an equivalent rally from approximately $1.12 would imply nearly $1.99, not a confirmed target. Actual performance will fluctuate as a result of market conditions and follow-through price activity.
For now, the setup remains dependent on whether buyers defend support and overcome resistance. Holding $1.10 while reclaiming $1.14 would support the recovery scenario. Conversely, losing $1.00 would weaken the bullish case and increase downside risks.