
- SUI trades near its lower channel boundary, showing slowing downside momentum and a potential short-term reaction.
- Exchange netflows indicate steady outflows across the year as price weakens despite periodic inflow spikes.
- Intraday data shows modest recovery, though long-term pressure persists with supply expansion still unfolding.
SUI moves near a key technical area as the market weighs its descending structure, shifting netflows, and recent intraday recovery. Current conditions show a cautious environment while traders monitor whether short-term stability can form near existing support zones.
Broad Channel Structure Guides Market Response
SUI continues to trade inside a wide descending channel that has guided its movement for several weeks. Price sits near the lower boundary after an extended drawdown, forming the type of setup where temporary relief phases often emerge. The consistent respect for both channel edges shows a controlled trend that traders have navigated with precision.
A cluster of small-bodied candles near the lower trendline indicates slowing downside momentum. The reaction resembles conditions described in a post from Alpha Crypto Signal, which noted that liquidity thins near these boundaries as sellers take profit. These shifts often offer space for short-lived corrective movement within a dominant bearish structure.
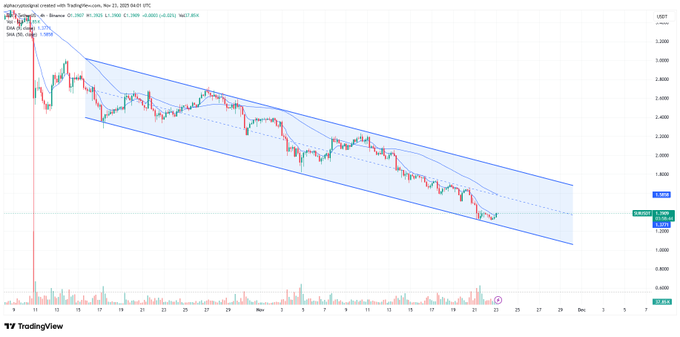
The 9 EMA continues to slope downward and rejects upside attempts. This moving average remains firm dynamic resistance and signals that broader direction still favors the downside. Any near-term reaction remains corrective unless SUI reclaims both the mid-channel region and the EMA with a convincing close.
Netflows Reflect Changing Liquidity Behavior
The SUI Spot Inflow/Outflow chart shows frequent red bars throughout the year, revealing persistent exchange outflows. Such behavior often aligns with reduced selling pressure, though SUI’s steady decline despite these outflows points toward demand weakening during extended downtrends. The flows create a backdrop of gradual liquidity withdrawal.
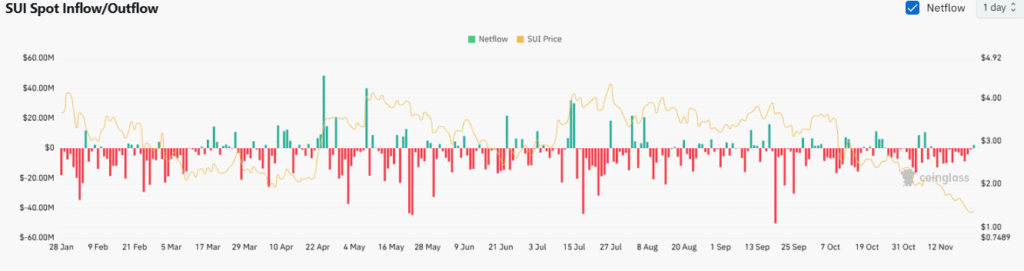
Several notable inflow spikes appeared in April, May, June, and July. These movements often exceeded $20M and sometimes moved toward $40M. Such spikes occurred during periods when SUI attempted stabilization or small rallies. Market behavior around these events suggests traders used strength to rotate tokens back into exchanges.
From August forward, netflows shifted again as outflows became more consistent. Price declined through the $3 area toward $2 while deeper red spikes emerged in September and October. Market fatigue became evident entering November as SUI fell near $0.74 without major flow surges, signaling quieter activity rather than strong directional pressure.
Intraday Data Shows Short-Term Recovery Attempt
SUI recorded a 24-hour gain of 2.9%, trading around $1.38 while moving between $1.32 and $1.40. The pattern shows incremental buying and steady formation of higher lows. The curve suggests that buyers engaged consistently through the session without relying on volatility-driven impulses.
Market cap stands near $5.07B, while the fully diluted valuation remains higher at $13.77B due to ongoing supply release. Circulating supply sits at 3.68B SUI out of a 10B cap. These numbers reflect early-phase issuance that continues to influence long-term valuation structure.
Trading volume reached $583M within the past day, showing stable activity across major venues. The intraday uptrend developed without extreme volume increases, pointing to measured accumulation rather than aggressive breakout action. The broader market still observes long-term pressure, yet the short-term pattern attempts to stabilize conditions.


