- SUI shows weakness with volume dropping over 50%, yet bullish sentiment from traders remains dominant.
- Gordon highlights a demand zone at $3.50–$3.70, calling it a make-or-break level for buyers.
- Market data reveals $11.21B capitalization with SUI holding a key ascending trend structure.
SUI is currently testing key technical zones as traders watch closely for confirmation of trend continuation. Market participants are focused on support and resistance dynamics that could determine the next phase of movement.

Demand Zone and Technical Structure
Analyst Gordon (@AltcoinGordon) emphasized the importance of the $3.50–$3.70 region, describing it as a demand zone where buyers stepped in earlier. His post, “Oh look, $SUI bouncing off my line. Connect the dots or stay broke,” referenced the price reaction around this area. Historically, this block coincided with prior consolidation and breakout levels, now functioning as support.
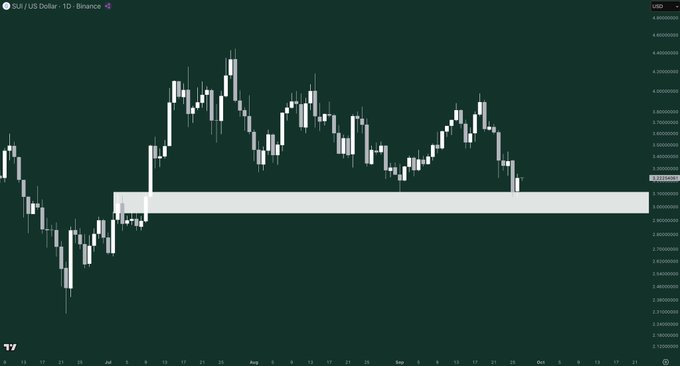
Price action shows that SUI retraced from near $4.50, printing lower highs during September. The demand zone remains a structural base, as the market recognizes this level as a foundation for trend continuation. If the zone continues to attract demand, a rebound toward $3.90–$4.10 may occur. A stronger breakout could extend gains toward $4.30 and possibly retest $4.50.
Failure to hold above $3.50–$3.70 would instead expose the market to pressure. A daily close beneath this block could open downside targets around $3.20 or even $3.00. Traders are closely monitoring the reaction at this zone to gauge the strength of bulls against persistent sellers.
Market Data and Sentiment
SUI trades at $3.14, down 2.15% in 24 hours, while maintaining a market capitalization of $11.21 billion. The fully diluted valuation stands at $31.42 billion, reflecting potential expansion if maximum supply circulates. At present, 3.56 billion SUI are circulating out of 10 billion, leaving considerable room for future unlocks.
The 24-hour volume decreased drastically by 52.73% to $532.8 million to indicate a lower activity as compared to previous sessions. Community voting is still optimistic with 84% of the participants projecting a bullish outlook and 16% bearish. Such a non-alignment between volume and sentiment is an indication that traders believe that the consolidation is temporary and that once the consolidation is reached, the traders predict further upside.
The volume to market cap ratio of 4.75% shows that it is moderately liquid with capitalization size. This ratio used in conjunction with the level of circulating supply is used to reflect how fast sentiment changes can affect direction in the near term.
Ascending Support and Risk Levels
Technical data suggests SUI has been attempting to maintain an ascending trend structure. The token recently bounced from support around $3.21, confirming that buyers remain active at lower levels. Although the current dip places pressure on this line, the structure remains intact.
The recent rallies came to an end at resistance levels of $3.22-$3.25 resulting in a sideways movement. They are usually followed by bigger directional moves with the help of a new trading volume. A long-term position of above $3.20 can enable the bulls to regain traction and will have the ability to pursue the higher levels of above $3.35-$3.40.
Conversely, a down-break of less than $3.10 may transfer the control to the sellers. This would expose SUI to stretching losses, and retesting of deeper supports. Traders are still evaluating whether the existing weakness is a retest, or the beginning of a new bearish attack.


