
- SPX6900 shows a classic head-and-shoulders structure, signaling potential reversal if neckline support near $1.10 breaks.
- Analyst Ali projects a downside target of $0.58 if the bearish formation confirms with a close below support.
- Current SPX6900 trading at $1.41 reflects -1.91% daily decline but still holds a 19.58% 7-day gain.
SPX6900 ($SPX) is displaying a technical setup that has drawn close attention from traders as it forms a head-and-shoulders structure. The pattern, often associated with bearish reversals, could point to deeper declines if neckline support fails.

Bearish Formation Develops on Chart
Analyst Ali (@ali_charts) shared that SPX6900 appears to be shaping a head-and-shoulders pattern, with the left shoulder forming in late June, a head in late July, and the current price action creating the right shoulder.
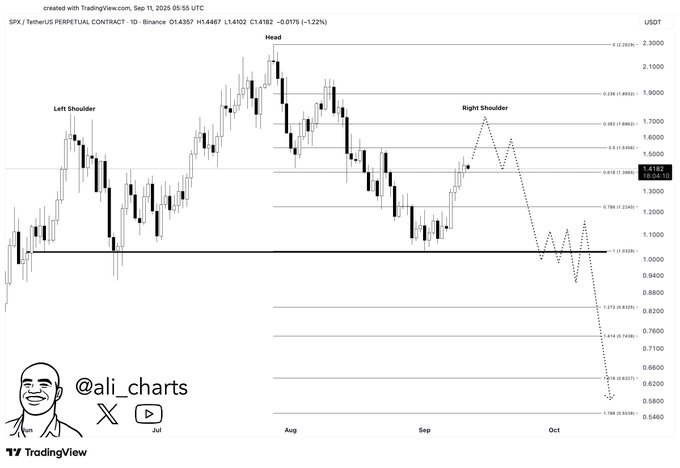
This structure typically signals exhaustion in prior rallies and a possible shift toward bearish control. The right shoulder is projected to develop between $1.60 and $1.70, an area aligning with Fibonacci retracement levels where strong resistance often occurs.
Such alignment between price action and Fibonacci zones adds strength to the bearish perspective. If buyers fail to reclaim ground beyond this range, traders will closely watch for confirmation of reversal.
Neckline Defines the Critical Level
The neckline of the formation lies near $1.10, acting as a key dividing line for SPX6900. This support has been tested before, making it a crucial zone for both bulls and bears.
According to Ali, a decisive break and close below $1.10 would activate the bearish setup. The measured move principle places the downside projection near $0.58, representing a substantial decline from current levels.
Intermediate levels around $1.00, $0.84, and $0.76 may serve as temporary supports. Still, momentum below $1.10 would keep pressure on sellers’ side, driving price toward deeper retracement targets.
Market Performance and Outlook
SPX6900 is trading at $1.41 with a 24-hour decline of -1.91%, though it maintains a 19.58% gain over the past week. Trading activity reached $33,705,334 in volume, reflecting strong participation during this consolidation phase.
Additional commentary from RealCobraW noted that the fifth wave may have completed, suggesting a shift in trend conditions. This perspective supports the possibility that current levels may represent exhaustion before a larger correction.
Despite the bearish structure, confirmation is still pending. A neckline breakdown is necessary to validate the move toward $0.58. If buyers reclaim momentum and break past $1.70, the bearish outlook would be invalidated, shifting attention to higher targets.


