
- SOL has fallen 6% in 24 hours and 15.61% in seven days, while its latest quote sits near $75.74 with daily volume near $3.32 billion.
- Long positions account for 71% of roughly $1.06 billion in liquidations across the displayed period, showing the cost of this decline.
- The $21.326–$37.309 DCA zone remains a lower reference if SOL fails to hold support and enters another correction across coming weeks.
Solana price outlook weakens as weekly losses deepen and leveraged longs face liquidations. SOL has fallen 6% in 24 hours and 15.61% over seven days. Its latest quote is $75.74, with daily volume near $3.32 billion.
Solana’s Declining Structure Puts Buyers Under Pressure
Anonymous | Crypto Predictions says the trader is adding SOL to a spot portfolio. The trader marks $21.326–$37.309 as a lower DCA zone if support fails. That plan treats current prices as one entry, reserving lower levels for further weakness.
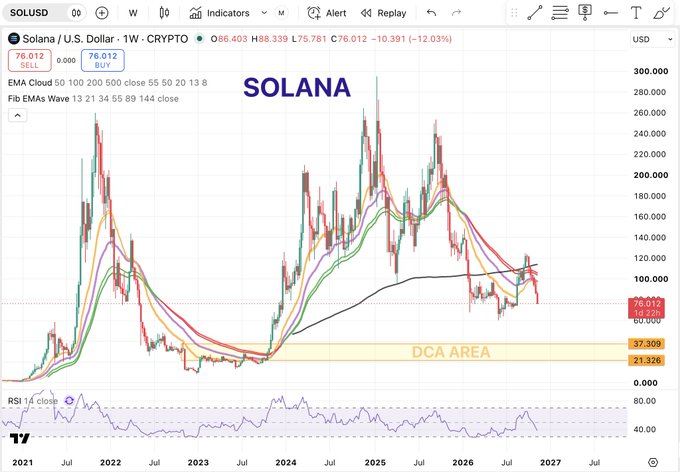
The weekly chart shows SOL retreating from its 2025 highs near $280–$290. It has since fallen below several moving averages, now clustered around $100–$120. The latest weekly candle opened at $86.403 and reached $88.339 before falling toward $75.781.
Earlier price history shows a long decline into the $20 region during 2022–2023. SOL then recovered through late 2023 and 2024, eventually moving above $200. The latest decline has erased much of that advance, returning attention to former support.
Heavy Long Liquidations Accompany the Price Decline
Liquidation data adds another measure of pressure on the market. Long liquidations totalled $757.8 million, against $302.3 million in shorts. Longs therefore made up approximately 71% of reported liquidations.
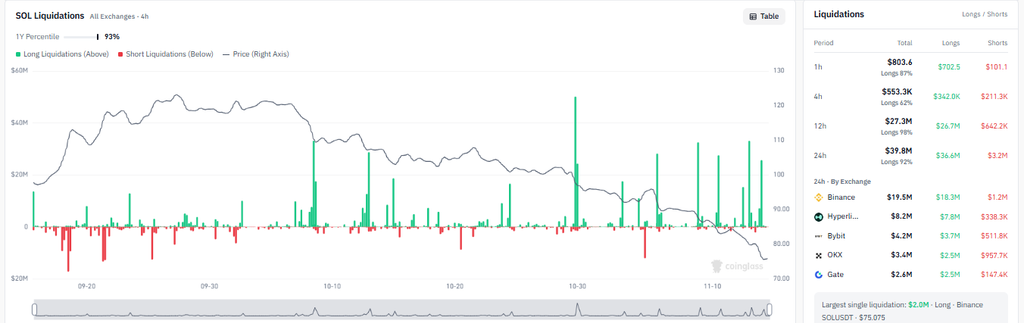
The liquidation chart shows SOL falling from around $120 toward $75. Large green spikes appeared during sharp declines, showing forced closures of bullish positions. The largest single event reached $51.6 million on October 29 at 23:00.
Recent figures show the imbalance continuing across shorter periods. Over 24 hours, liquidations totalled $39.8 million, including $36.6 million in longs. The 12-hour reading reached $27.3 million, with $26.7 million coming from long positions.

Binance recorded the largest 24-hour exchange total at $19.5 million. Hyperliquid followed with $8.2 million, while Bybit recorded $4.2 million. OKX and Gate registered $3.4 million and $2.6 million, respectively.
The $21–$37 Accumulation Zone Remains in Focus
The $75 area now sits near the market’s latest liquidation reference. The chart records a $2 million long liquidation on Binance at $75.075. A sustained hold could help SOL stabilise, while another break lower may bring further selling.
The weekly moving-average cluster remains overhead and may restrict recovery attempts. SOL would need to reclaim the $100–$120 area to improve its weekly structure. The RSI has weakened but remains above its deepest historical readings.
The marked accumulation zone extends from $21.326 to $37.309. Its upper boundary is the first reference if the market enters a deeper correction. The lower boundary marks the more distant level identified in the trader’s plan.
That zone overlaps the broad price area where SOL formed a base in 2023. The earlier consolidation preceded a strong advance through the following market cycle. However, the chart does not establish that SOL will revisit those prices.
For now, SOL must defend the mid-$70s while facing overhead resistance. Heavy long liquidations show how leveraged bullish positions have been affected. Coming weekly closes should show whether support holds or the lower DCA range matters.