
- Solana’s market structure shows a stable consolidation zone with firm demand near the $132–$133 area.
- Exchange flows reveal ongoing supply tightening as strong outflows fail to lower the Solana price.
- Liquidity data points to steady absorption and a potential expansion phase when volume returns.
Solana’s recent market activity shows steady consolidation supported by tighter supply conditions. Liquidity patterns, exchange flows, and short-term trading behavior point to a stable structure as traders assess the next potential directional move.
Accumulation Structure and Broader Market Context
Solana’s broader chart structure has drawn renewed attention after a detailed market outlook shared by Whale.Guru, who noted a large accumulation zone forming after a strong upward leg. This structure reflects a prolonged consolidation period following an earlier expansion wave.
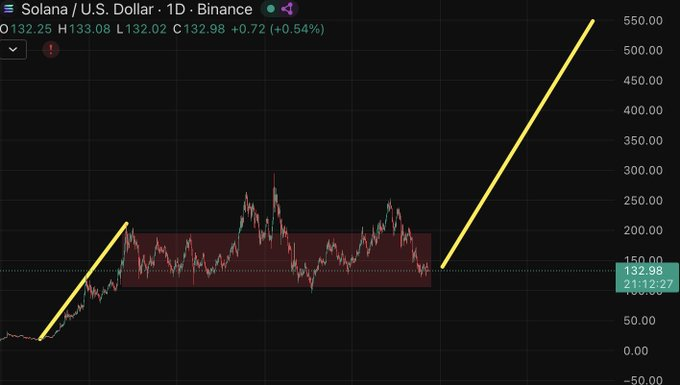
That phase produced a base where repeated retests of lower levels held firm. The range behaved as a demand shelf where long-term participants accumulated positions while short-term traders attempted breakout moves across the top of the zone. Each rejection reinforced the view that liquidity was being collected.
The chart shows Solana retesting the lower boundary of this range without breaking its structure. That signals stability at current levels and sets the stage for an eventual upward continuation if fresh demand returns. It also keeps the technical projection intact.
Liquidity Conditions Based on Exchange Flows
Exchange netflows show a persistent series of outflows through much of the observed period. Outflows during sideways price movement often suggest long-term participants moving assets off exchanges and reducing immediate selling pressure.
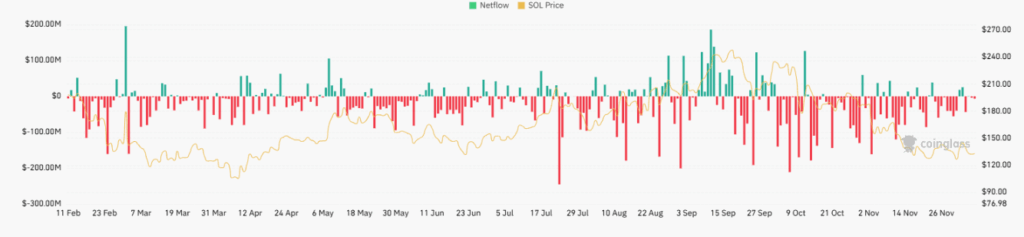
Earlier in the year, the chart shows strong outflows during a price decline, which matched defensive behavior in the market. The pattern changed as intermittent inflows appeared in late spring and summer, aligning with short-term price lifts and reactive buying.
From October onward, deeper outflows reappeared but did not push the price sharply lower. This setup points to reduced exchange supply. When sellers withdraw coins while price stays firm, the market often enters a supply-tight environment that can support future volatility.
Short-Term Trading Metrics and Current Market Standing
Short-term price action is at $132.90 showing a calm consolidation phase. Daily volume dropped more than 53%, signaling reduced speculative activity after recent volatility. Low volume with stable price behavior points to cautious trading conditions.
The intraday chart shows alternating small green and red waves, reflecting attempts to move higher that met steady selling. A deeper wick during off-peak hours shows a liquidity sweep rather than directional momentum. Still, price held the $132–$133 region firmly.
Market cap stands at $74.5 billion with an FDV of $81.8 billion. The circulating and total supply levels show moderate issuance pressure. Together, these metrics support a market holding structure while waiting for renewed participation.


