Key Insights:
- Solana trades above $85 as rising retail demand lifts derivatives activity, pushing open interest higher and reinforcing bullish positioning in the short term.
- Short liquidations dominate recent market activity, while positive funding rates and long-to-short ratios highlight growing confidence among traders expecting continued upside momentum.
- Institutional demand weakens as Solana ETFs record outflows, suggesting limited support from large investors despite improving sentiment and increasing retail-driven market activity
Solana trades above $85 on Monday, extending gains as the broader crypto market stabilizes and risk appetite improves across digital assets. The move places SOL near a critical resistance zone, where price action now tests a short-term descending trendline alongside the 50-day EMA. Besides the price strength, traders are closely watching whether this level can hold as momentum builds gradually.
Derivatives data shows a clear increase in retail participation, with open interest rising to $4.98 billion over the past 24 hours. Additionally, liquidations reached $5.43 million, with short positions accounting for most of the losses, reflecting stronger buying pressure. The funding rate remains positive, which indicates that traders continue to favor long positions. Moreover, the long-to-short ratio has moved above parity, reinforcing expectations of further upside in the near term.

Institutional Demand Shows Signs of Weakness
However, institutional flows present a contrasting picture, as Solana-linked exchange-traded funds recorded $1.24 million in outflows last week. This shift follows a previous week of stronger inflows, signaling reduced participation from larger investors. Consequently, the lack of institutional support could limit the pace of the ongoing recovery. While retail demand drives short-term momentum, broader market confidence still appears uneven.
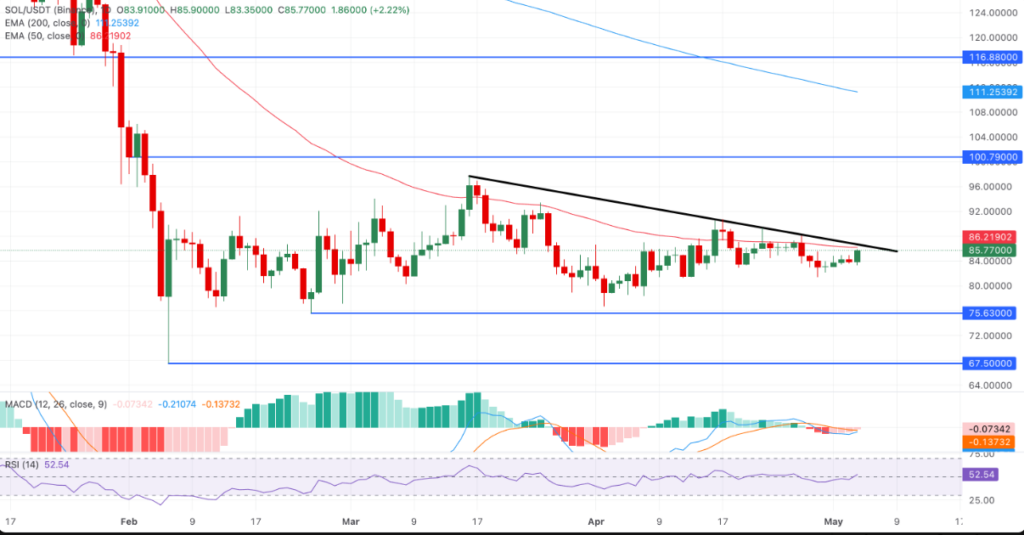
Technically, Solana faces immediate resistance near the 50-day EMA around $86, with the descending trendline slightly above that level. A decisive move beyond this zone could open the path toward $100, provided buying pressure sustains. Additionally, the Relative Strength Index sits near neutral levels, indicating balanced momentum without overbought conditions. The MACD indicator also points to weakening bearish pressure as histogram bars shrink steadily.
Downside Risks Remain in Focus
On the downside, failure to reclaim the $86 region could trigger a pullback toward lower support levels. The February low near $75 remains a key level that traders may revisit if selling pressure returns. Hence, price action around the current resistance zone will likely determine the next directional move.