
- Solana’s rising wedge pattern suggests a possible move toward $160 if lower support fails to hold.
- SOL remains stable near $203 with $200 acting as strong short-term support and $204 as immediate resistance.
- Trading volume dipped 41.97% to $2.96B, but liquidity levels remain healthy with a $110B market capitalization.
Solana (SOL) continues to trade within a structured formation, showing stability in the near term but also raising caution through technical patterns. Analysts remain focused on support and resistance zones, with market participants tracking price behavior closely.

Rising Wedge Pattern Signals Risk
Ali (@ali_charts) pointed to a clear rising wedge forming on the SOL/Tether perpetual chart. This pattern, developing since June, is defined by converging trendlines with price consistently creating higher highs and higher lows. The structure reflects slowing momentum and waning buyer conviction as the wedge tightens.
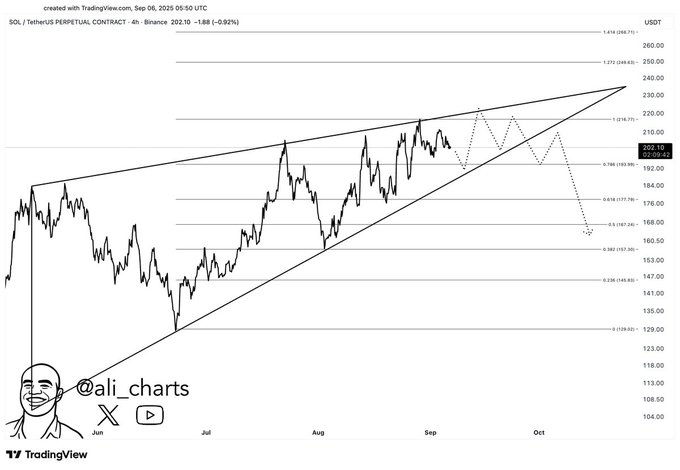
A rising wedge that appears after an extended upward move often signals a possible reversal. The chart’s Fibonacci retracement grid offers insight, projecting that a breakdown could push SOL toward deeper retracement levels. Ali highlighted $160 as the measured target, aligning with prior structural support and Fibonacci reference points.
The expected price path suggests initial consolidation followed by a failed attempt to post new highs. Such moves often trap weaker positions before a breakdown. A confirmed breach of the lower wedge, paired with higher selling activity, would validate the bearish scenario.
Short-Term Market Performance
As of writing, Solana priced at $203.33 with a slight 0.56% gain per day. SOL had earlier in the session fallen below the mark of 201 and was recovering. The bounce confirmed the high level of buying interest around the psychological level of 200 which remains to be a short term support.
The current market capitalization is phenomenally at $110.18 billion which has increased by 0.69 percent indicating a consistent investor trust. Nonetheless, trade activity has calmed down as the 24-hour volume fell by $41.97% to $2.96 billion. This has not affected the liquidity which is intact with a 2.68 per cent volume-to-market capital ratio.
The next resistance is around mono $204 at which the sellers have limited further growth. If SOL maintains pressure above this level, price could attempt to build higher ranges. On the downside, losing the $200 mark would open a path toward lower zones, aligning with the broader wedge risk.
Supply Metrics and Trading Scenarios
Regarding supply, Solana has a total supply amounting to 609.18 million tokens out of which $541.88 million are in circulation. This implies that the aggregate supply is almost 89 percent of the total supply, restricting new supply, but leaving long-run supply unrestricted. As opposed to Bitcoin, Solana lacks a fixed supply, which makes demand-based factors the core of its valuation.
Practical trading scenarios revolve around confirmation levels. For bearish setups, short positions are valid after a confirmed breakdown and retest of the wedge’s lower boundary. Targets would include $192 and $176 before extending to $160. In bullish exposure, a decisive move above the upper line of the wedge would nullify the bearish pattern, and this could be followed by additional Fibonacci extensions.
Derivative markets continue to play a significant role in the volatility in the near term. Directional moves may happen faster with funding rates and open interest levels. This makes monitoring structural breaks and retests vital for managing exposure effectively within the wedge.


