- SOL remains above important recovery levels, while the roadmap identifies $108 and $145 as early technical checkpoints ahead.
- Derivatives positioning remains elevated across major exchanges, with August short exposure preceding a sharp recovery toward higher levels.
- The longer-term structure maps several resistance zones before reaching the projected $1,000 target and higher Fibonacci extensions.
SOL remains positioned around a key technical area as its historical structure, derivatives activity, and recent recovery converge around important resistance levels.
Long-Term Structure Establishes the Roadmap
The chart presented by Crypto Patel maps a long-term technical progression for SOL. It begins with the 2021 advance and subsequent multi-year descending structure. Price eventually reached an accumulation phase before breaking higher during the following cycle.
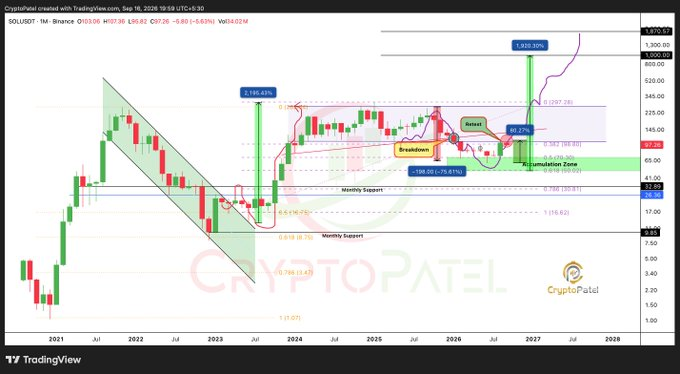
That breakout produced a measured move of approximately 2,196.43%. The advance was followed by broad consolidation between major horizontal technical levels. Price later broke beneath that structure, creating the breakdown shown on the chart.
The recovery phase now focuses on reclaiming previously established resistance. The chart records an 80.27% advance from the lower region. That move returned price toward the upper boundary of the recent structure.
The roadmap identifies several Fibonacci and horizontal levels across the broader chart. The first important references appear around $108 and $145. Above those zones, approximately $260 and $297 become additional technical checkpoints.
Derivatives Activity Shows Shifting Positioning
The derivatives chart shows substantial positioning across major cryptocurrency exchanges. Binance leads open interest with approximately $1.01 billion in SOL contracts. Bybit follows with roughly $658.60 million in open interest.
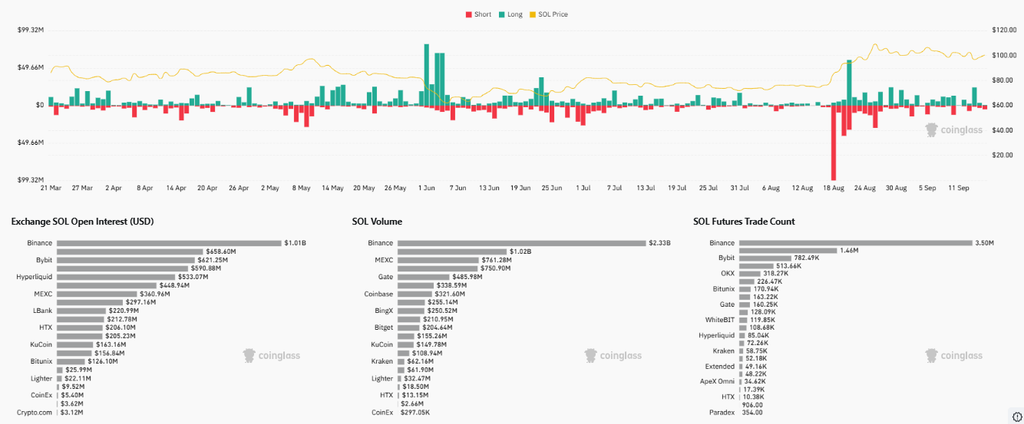
Trading activity is also concentrated across leading exchanges. Binance records approximately $2.33 billion in reported SOL volume. MEXC and Gate follow with about $761.28 million and $750.90 million.

The sharpest positioning event appeared around August 18. A large short-position spike emerged while price remained near its lower trading range. The subsequent recovery carried price toward and eventually above the $100 area.
This sequence shows how quickly leveraged positioning can change during volatile periods. Long exposure increased as the recovery developed after the August weakness. Meanwhile, price maintained a higher range through the beginning of September.
Intraday Recovery Keeps Key Levels in Focus
The latest chart shows a strong recovery after an early decline toward the $96 region. Price later established successive higher lows throughout the session. That structure eventually carried SOL through the $98 and $99 areas.
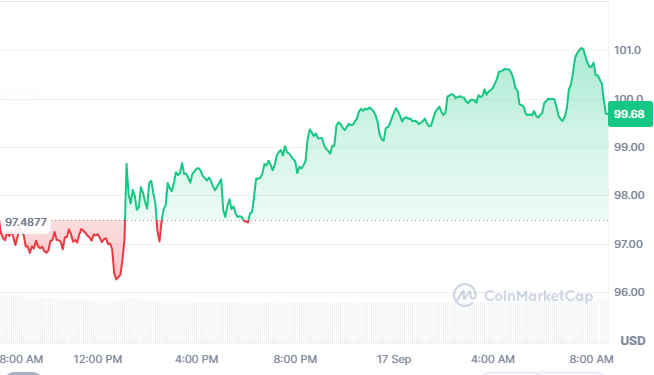
SOL as of writing trades at $100.35, up 3.28% over 24 hours. Market cap is around $58.92 billion and the volume over the last 24 hours is around $3.41 billion. The new price is still well off the $101.10 session high.
The $100 area therefore remains an important psychological reference. A sustained position above it would keep the recent recovery structure visible. A rejection could instead bring the $99 and $97.50 areas back into focus.
Beyond the immediate range, the longer roadmap extends toward substantially higher technical levels. The chart eventually projects $1,000, followed by zones near $1,300 and $1,920. These levels represent long-term extensions requiring multiple resistance breaks along the way.