

Key Insights:

- Shiba Inu stabilizes near $0.0000098 as buyers regain control following an intense market correction that drove prices to new lows.
- Technical indicators like RSI near oversold levels suggest that SHIB could soon attempt a breakout above short-term resistance levels.
- Rising volume and on-chain wallet activity point to renewed investor interest, signaling a potential start of a short-term price recovery.
Shiba Inu is showing early signs of stabilization after enduring one of the year’s toughest corrections. Following a market-wide selloff that caused the meme token to add another zero to its price, SHIB is now consolidating around $0.0000098. The current movement suggests that selling pressure has eased, allowing the token to establish a potential base for recovery.
Market data indicates that sellers have begun to lose momentum. After the liquidation-driven drop that pushed SHIB below $0.000010, buying activity has steadily increased. The rise in buying volume reflects renewed trader confidence and suggests that investors are beginning to accumulate positions at these lower levels.
Technical Indicators Show Early Reversal Signs
Despite recent volatility, trading sessions have shown smaller candles and lighter activity, signaling market hesitation before a possible breakout. SHIB is still trading below its 50-, 100-, and 200-day exponential moving averages, meaning it has yet to regain a clear short-term bullish pattern. However, these conditions often precede a reversal phase if market sentiment continues improving.
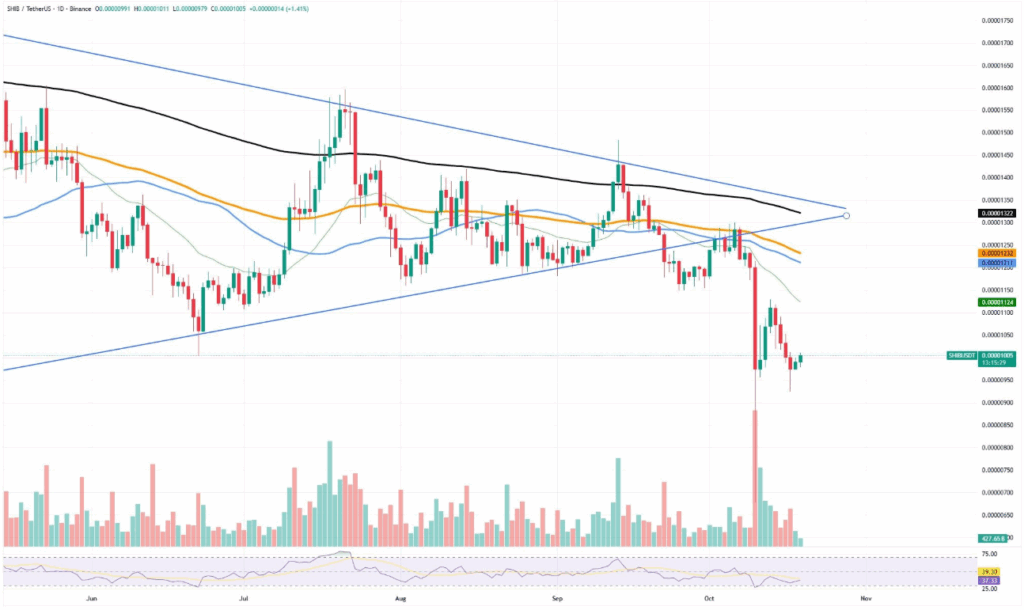
The Relative Strength Index (RSI) is hovering near 39 points toward oversold territory, where reversals often occur. If the token sustains its momentum and surpasses the $0.0000105 mark, it may attract more momentum traders. A sustained move above the $0.0000112 to $0.0000120 resistance range could strengthen the recovery trend and encourage retail inflows.
Volume and On-Chain Data Indicate Accumulation
Market observers note that trading volume in the next few days will be critical for confirmation of a reversal. A steady increase in green candles above $0.0000105 would reinforce accumulation signals. Additionally, on-chain data showing higher wallet activity and exchange outflows could further support a bullish outlook, as these indicators often accompany the start of short-term rallies.


