- SHIB is consolidating near long-term support after years of decline, but the weekly chart shows no confirmed break above resistance.
- The recent low near $0.00000478 provides an immediate support level for SHIB following failed rebounds.
- Rising trading volume accompanied SHIB’s daily decline, while the token’s next move depends on support holding and buyers reclaiming resistance.
SHIB support remains a central price concern as Shiba Inu struggles to recover, with its weekly downtrend meeting a long-standing floor.
SHIB Holders Face Another Test Near Support
SHIBMortal’s latest post asks how many holders remain invested through SHIB’s prolonged decline. The weekly chart is nearing the bottom of its descending series, and the message points to consolidation above a key zone. It has been years since Price last rebounded from his prior peaks and a number of stumbles have not altered the overall trend.
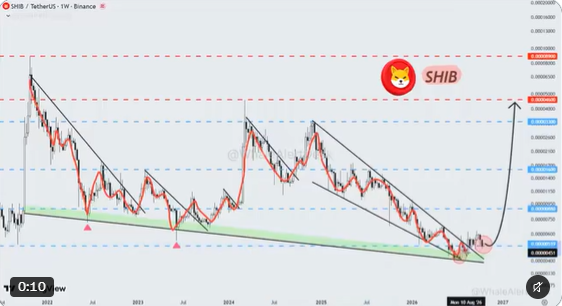
SHIB has been following the pattern of successive lower highs since it peaked in 2021 on the weekly chart. Every recovery faced resistance and was then sold off again. The general trend is continuing with recent candles building up near the lower boundary.
Current price action is below a green shaded long-term support zone. Pre-rebounds to this area were seen at earlier visits and this level is worth watching. However, those past reactions do not guarantee buyers will defend it again.
The chart also shows blue dashed levels above the current range, along with a higher red resistance area. These lines mark potential obstacles if SHIB begins recovering. Price has yet to break through the descending resistance that has capped previous advances.
Short-Term Chart Shows Selling Pressure
The shorter-term chart records SHIB at $0.000004818, down 0.69% over 24 hours. The price started to move upwards to $0.00000490 but the rally slowed. A later rebound also failed, leaving the token below $0.00000485.
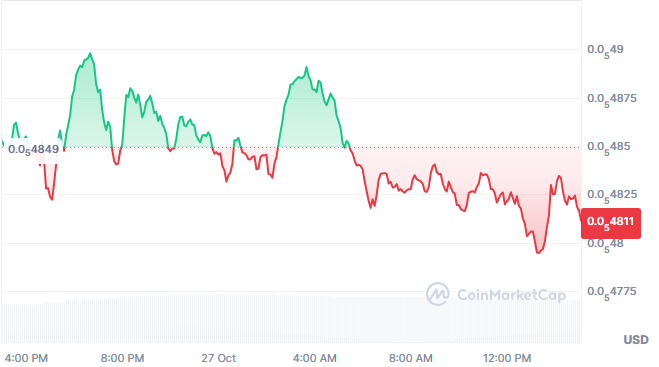
The $0.00000485 level has become an immediate point of reference. SHIB traded around this price earlier in the session, but sellers later pushed it lower. Buyers have not yet reclaimed the level with a sustained move.

Selling gathered pace during the morning as rebounds struggled to regain earlier highs. SHIB came close to $0.00000478 at around midday, before making a slight recovery. That bounce has not yet reversed the intraday decline.
Market data shows SHIB’s capitalization at approximately $2.83 billion. Trading volume reached $51.82 million over 24 hours, up 15.1%. More trading took place during a session in which the price fell.
A Recovery Needs Confirmation From Price
The last one lower price of $0.00000478 is the next support on the lower time frame. Another decline toward that area would test whether buyers return. A clear break beneath it could leave SHIB vulnerable to further losses.
On the weekly chart, the green support band carries greater importance for the broader structure. Losing that area would weaken the recovery path drawn on the chart. The descending pattern would remain in control unless price began reclaiming resistance.
The arrow is pointing up, which may represent an upward trend in price. That route relies on SHIB’s support and overcoming the barriers above. It cannot prove that a rally has started.
To get the short-term structure to improve, SHIB must break out of the $0.00000485 area and stay above it. A better step toward $0.00000487 would be confirmation of the buying pressure. Until then, the recent bounce remains limited.
SHIBMortal’s question about holders comes as SHIB trades near a long-tested floor. The weekly chart shows a consolidation area, with no clear breakout from the descending price action. The next price move will be determined by whether support or resistance is broken.