

- SEI has broken out of a long-term falling wedge pattern, signaling a potential shift in trend direction.
- In the last 24 hours, the rate has increased by 8.7% with resistance set at $0.2554 and support at $0.2344.
- If prices close above the breakout point and a larger upward trend is confirmed, it can target return to recent lows.
Following a historical doping run, SEI has managed to surpass an important falling wedge pattern, indicating a possible corrective shift in its trend. After a limited trading zone that started in late 2024 and held the price under lock in a downward trajectory, SEI has recently broken out. Currently, SEI is trading at $0.2592 with a 7.76% increase as of the last day.
SEI Breaks Out of Falling Wedge with Rising Volume
Trading above the upper line of a wedge structural pattern usually acts as a reversal signal, discerned by traders. In historical analysis, declines generally witness the formation of falling wedges that should break to the upside indicating imminent price recovery. For SEI, the latest increase in price has been underscored by increased trading volume that further proves the effectiveness of the breakout.
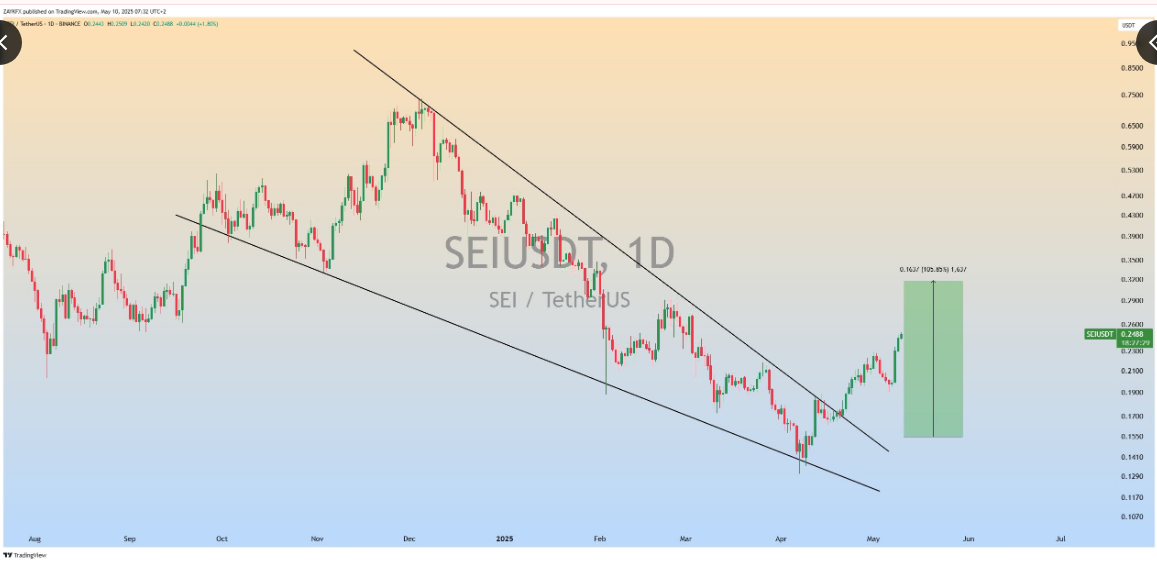
On a technical standpoint, the current resistance level is also positioned at the $ 0.2554 level, at a small distance of the market price. This level in the recent past has been a barrier and breaking through it may lead to an additional upward motion. The support area is roughly at $0.2344, a position that has continued to remain relevant during the previous pull backs.
Short-Term Outlook and Target Projections
Based on the size of the wedge pattern, technical indicators suggest the possible high point in case to be near to $0.29. There is a likelihood of 100% return based on its low at the time of the breakout. However, price movement remains subject to broader market conditions and investor sentiment, which can influence momentum.
In the next few days, investors will be watching volume and prices in stunning detail. Should SEI hold its value above $0.25 and establish a strong foundation, the market may build a way up to the expected target level.
Bottom Line
The overall technical profile of SEI has changed quite significantly over the recent trading patterns. Exiting a long-term falling wedge may show a bullish tone, yet the ongoing buying activity and explicit breaking of resistance levels will be the determining factor in establishing the success of this advance. The $0.29 level is likely to prove to be a key test for traders in days to come.


