
- RNDR’s rounded bottom breakout aligns with reclaiming $4 support and signals potential upside targets of $7.50 and beyond.
- Weekly RSI breakout and EMA reclaim confirm strong momentum, with projections toward $12 and medium-term resistance at $20.
- Price consolidation near $5 forms a bull flag, supported by $3.80–$4.00 levels, suggesting bullish continuation.
Render Token (RNDR) shows signs of a breakout following a rounded bottom formation and sustained price consolidation. The technical indicators reveal structure alignment, with resistance levels flipped into support and momentum building on key timeframes.
Rounded Bottom Structure and Price Reclaim
The chart displays a bullish structure that began forming near $1.50 and completed with a rounded bottom pattern. RNDR reclaimed major support zones and moved through resistance levels with consistent structure, showing increasing trend integrity.
AltCryptoGems, a leading analyst in altcoin patterns, provided technical confirmation of the rounded bottom pattern and resistance flip. According to AltCryptoGems, the neckline at $4.00 served as the pivot level during two breakout attempts. He observed that RNDR first broke the $4.00 level and reached a local high around $5.25 before consolidating.
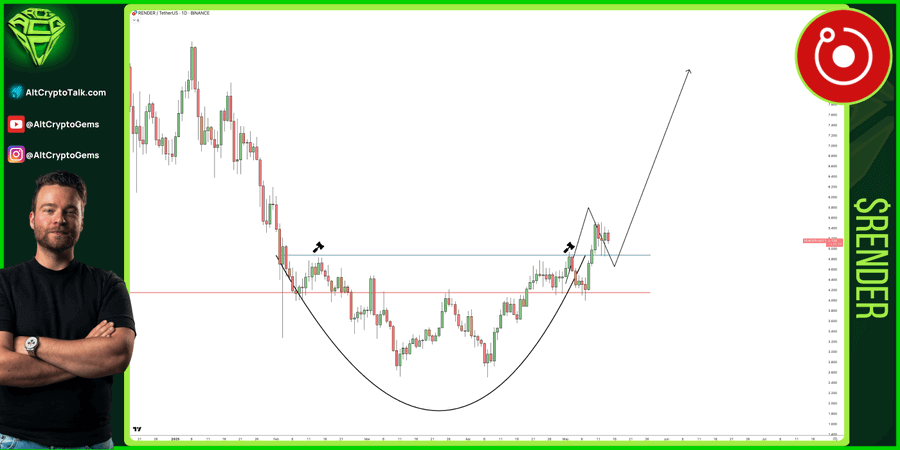
AltCryptoGems’ analysis identified two support levels at $3.80 and $4.00, both retested during pullbacks with successful reclaims. RNDR’s price compression between $4.30 and $5.00 formed a bull flag continuation pattern above the neckline zone. The projected upside path pointed to $7.50, based on the measured move from the rounded bottom.
The base structure, anchored near $1.50, supported accumulation before price reversed and aligned with the right shoulder of the pattern. Although volume data was not displayed, price behavior throughout the base suggested strong accumulation phases. He emphasized the neckline reclaim and symmetrical structure as signals of sustained bullish pressure.
Weekly Resistance, RSI Flip, and Long-Term Projection
Crypto Devil has provided additional insights by comparing key moving averages and RSI resistance levels on the weekly chart. His review focused on EMA convergence, RSI breakouts, and price positioning above support channels.
The chart included resistance levels at $20, $26, and $31, acting as medium- to long-term targets. RNDR recently broke its 20-week EMA and moved toward the 50-week EMA, trading above $5.00. According to Crypto Devil, holding above these EMAs remains critical for continuation toward $6.70.
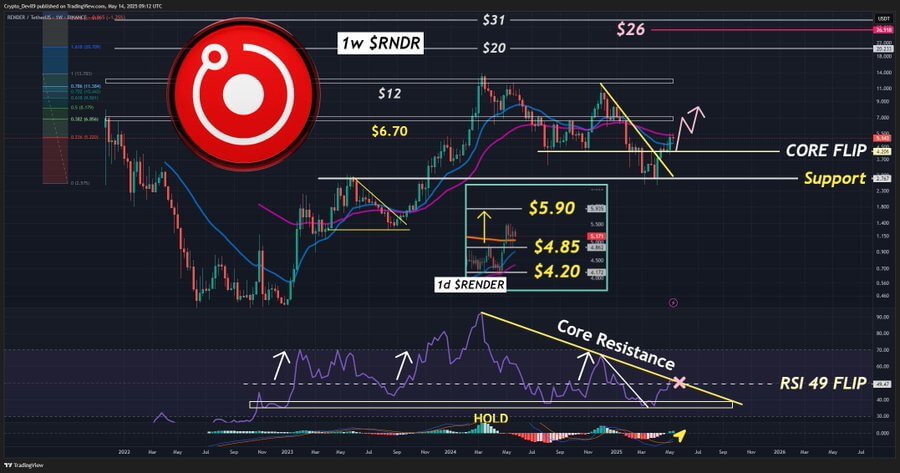
Crypto Devil noted the RSI breaking through the 49 level and touching a descending trendline labeled “Core Resistance.” This RSI flip marked a directional shift, aligning with prior market tops in late 2023 and early 2024. The analysis indicated that MACD lines showed early signs of bullish convergence.
Besides the EMAs and RSI, Crypto Devil identified a descending channel breakout supported by core flip zones. These zones acted as pivot points for previous accumulation before the price moved higher. The analyst also pointed out a short-term price range between $4.20 and $5.90 shown in the 1-day inset chart. This projection remains consistent with earlier observations. If support holds and momentum persists, RNDR could revisit $12, then $20.


