

- PEPE daily chart shows a symmetrical triangle with repeated lower highs, signaling continued seller pressure as price trades near support.
- Support rests around 0.0000090 USDT, while resistance is near 0.0000120 USDT, with potential targets set above and below range.
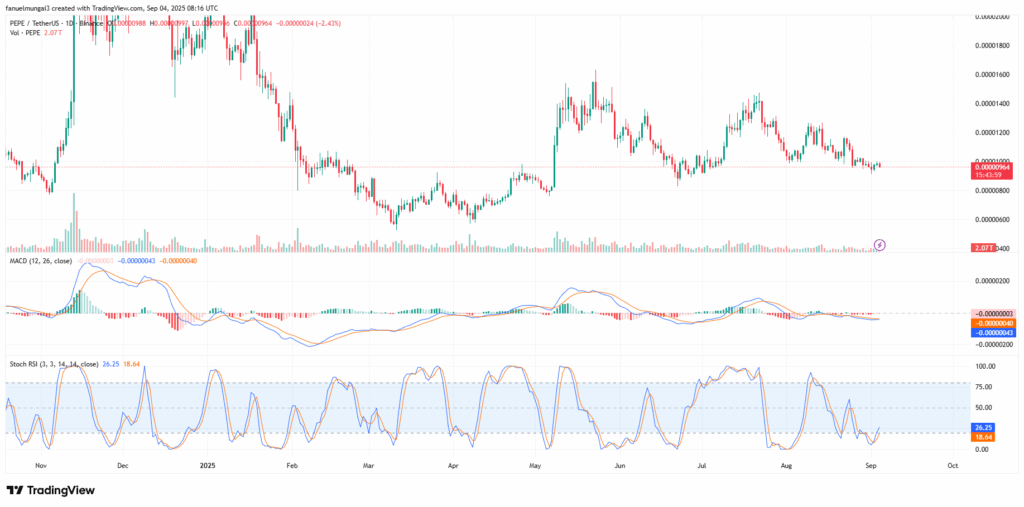
- MACD reflects weak market momentum, while Stochastic RSI near oversold territory suggests slowing downside pressure and possible short-term recovery signs.
PEPE is currently trading at a crucial point on the daily chart as price tests the symmetrical triangle support zone. Market structure signals growing pressure with momentum weakening and buyers struggling to regain control.
Symmetrical Triangle Structure on PEPE Chart
The PEPE/USDT daily chart outlines a symmetrical triangle pattern that has been forming since May. Price has created higher lows and lower highs, with points A–B–C–D marking the tightening range. This pattern often reflects market indecision before a decisive breakout.
During the move from A to B, PEPE rallied sharply before correcting down to point C, which built the lower boundary. A rebound toward D established a lower high, indicating persistent seller pressure. Since then, the price has compressed further toward the apex of the triangle.
Volume has steadily declined during this consolidation, a common trait for symmetrical triangles. Traders often monitor such patterns for strong breakouts once price nears the final squeeze zone.
Key Support and Resistance Levels
Crypto analyst Alpha Crypto Signal noted on X that PEPE is now sitting on the edge of support. According to the post, repeated lower highs show sellers pressing down, while buyers are finding it difficult to hold momentum.
Support for PEPE is found near 0.0000090 USDT, while resistance lies around 0.0000120 USDT. A breakout above resistance could extend toward 0.0000150–0.0000180. However, a confirmed breakdown might expose the lower zone near 0.0000070.
The trader also cautioned that PEPE appears heavy at current levels, with the possibility of breakdown seeming stronger than breakout. This makes the 0.0000085 – 0.0000080 area an important level if sellers extend control.
Indicators Suggest Weak Momentum
Looking at indicators, the MACD on the daily chart remains weak. Both lines hover just below the zero line, with the histogram showing minimal bars. This signals indecision and muted momentum in either direction.
The Stochastic RSI is currently near oversold territory, with values of 26.25 and 18.64. This suggests downside pressure may be easing, though sellers still retain partial control. A crossover in this zone could set up a short-term recovery.
Overall, PEPE is trading close to the lower boundary of its triangle structure. The next move will depend on volume confirmation and broader market sentiment, particularly Bitcoin’s performance.


