
- ONDO moves toward its $0.44–$0.45 demand area after another rejection at the upper range boundary.
- Market data shows steady participation as the token remains inside a defined range with clear supply and demand zones.
- Traders assess support strength as ONDO tests the same level that has triggered rebounds for nearly two weeks.
ONDO continues to trade inside its established horizontal structure as the market returns to a familiar support region. The token remains range-bound, and traders are monitoring whether the current test of demand will maintain the pattern seen in recent sessions.
Range Structure Guides Short-Term Direction
ONDO has been operating inside a steady range with the upper boundary near $0.51–$0.52 and a lower band at $0.44–$0.45. This area has shaped price behavior for nearly two weeks, creating consistent responses at both extremes. The current move toward the lower boundary places attention on whether buyers will maintain their past activity.
A tweet from CryptoPulse remarked that ONDO remains inside a “clean range,” noting repeated reactions at the same levels. This aligns with recent chart activity, which shows orderly rotations between supply above and demand below. Market participants have treated these zones as decision points, reinforcing their relevance across intraday movements.
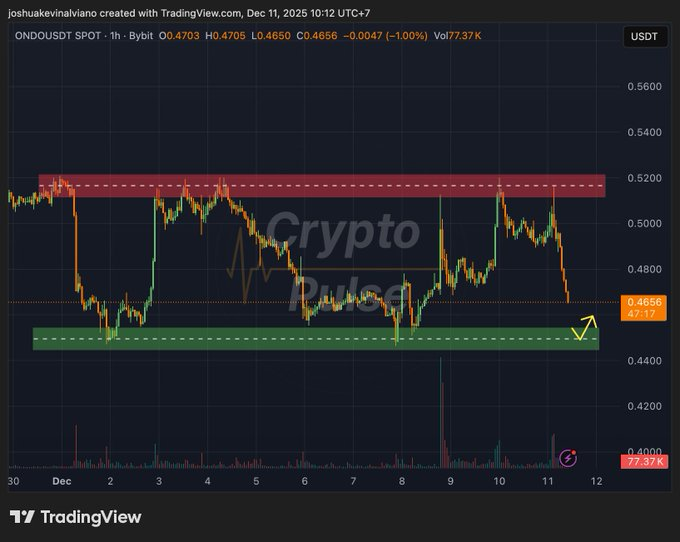
The recent decline formed after another rejection near the upper boundary. The price fell toward $0.4703 as the market cap slipped to $1.48 billion. This move fits the ongoing rhythm of supply-driven rejection and subsequent return toward demand.
Supply Pressure Drives Rejections Near $0.52
Each advance into the $0.51–$0.52 region has triggered fast sell-offs. The upper range displays a clear concentration of sellers, with repeated wicks signaling aggression from larger positions. These rejections have shaped short-term sentiment and prevented escalation into new trends.
The sharp downturn seen in the last session followed the same pattern. ONDO briefly pushed higher before fading into steady selling. The chart shows a swift decline in market cap as price weakened, suggesting continued preference from sellers near the upper limit of the range.
Despite bearish movement, volume grew by 3.84% to $102.4 million. Increased activity during declines signals active repositioning rather than inactivity. The market continues to recognize the upper boundary as a zone where liquidity concentrates.
Demand at $0.44–$0.45 Remains Key to Stability
The lower boundary near $0.44–$0.45 has held firm through multiple tests. ONDO has produced strong rebounds from this zone, often recovering toward the mid-range once liquidity is absorbed. Past reactions in this area show efficient buyer interest.
As ONDO approaches this level again, traders are watching whether support can absorb current pressure. The token trades with 3.15 billion circulating supply, and the unlocked market cap of $2.29 billion creates conditions where supply flows can weigh on price. Even so, the range has remained intact.
Market cap/TVL at 0.7891 and TVL at $1.88 billion continue to anchor structural confidence. If buyers repeat their past reactions, ONDO may rotate back toward $0.51–$0.52. A break below demand would mark the first shift away from the defined structure, though current movement remains consistent with prior range behavior.


