
- NEAR Protocol shows bullish momentum inside a symmetrical triangle, with $6.50 projected as the breakout target.
- Existing circulation at 98% minimizes dilution risk, and a stable liquidity due to lower volume of daily trade.
- The $2.40 support and the $2.50 resistance are critical levels as investors await to confirm the breakout.
NEAR Protocol is tightening within a symmetrical triangle on higher timeframes, reflecting prolonged consolidation. Technical indicators show momentum shifting toward buyers, with pressure mounting for a breakout that could define the token’s next trajectory.
Symmetrical Triangle Formation Points to Bullish Setup
NEAR Protocol (#NEAR) has spent months consolidating inside a symmetrical triangle, a structure that compresses price through converging trendlines. This formation typically signals a buildup of momentum that precedes a decisive breakout. Lower highs and higher lows continue to narrow the trading range, underscoring the compression underway.
Butterfly (@butterfly_chart) noted that NEAR is “coiling tight within the symmetrical triangle,” with volume steadily declining as the apex approaches. Historically, such volume contraction reflects trader hesitation until confirmation arrives. Once a breakout occurs, volume often expands quickly, driving strong moves in the confirmed direction.
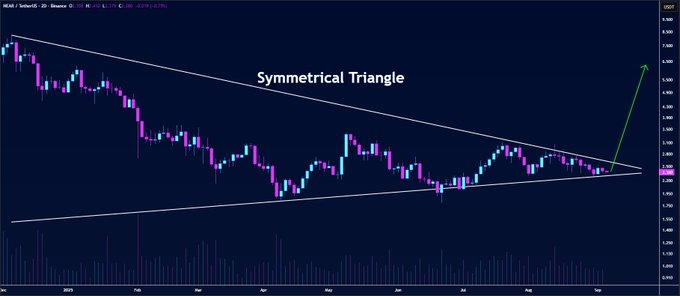
Technical momentum indicators favor the bullish case. Repeated defense of the lower boundary demonstrates strong demand, while multiple retests of the upper resistance line suggest weakening seller conviction. These conditions often prime an asset for a breakout higher, aligning with Butterfly’s projection toward $6.50.
Market Performance and Supply Dynamics
NEAR is as of writing, trading at $2.46, an increase of 2.64 percent in the last 24 hours. Price has come off of intraday lows around the area of $2.39, and the rebound has been sustained by consistent buying pressure. The session demonstrates resilience as momentum builds closer to the $2.50 resistance level.
Its market capitalization has increased to $3.07 billion and fully diluted value stands at 3.12 billion. This close gap indicates supply transparency where 1.24 billion tokens are in circulation, out of 1.26 billion total, translating to an excess of 98% unlocked supply. With little risk of heavy dilution, liquidity conditions remain stable.
However, daily trading activity has eased. The volume decreased to 22.47% to $97.12 million with a volume to market cap ratio of $3.13. Although the participation has decreased, liquidity is sufficient and enables orderly trading execution. An increase in volume on a breakout would lend more credibility to the bullish story.
Key Levels to Watch Moving Forward
The zone at $2.40 has re-appeared as short term support as buying activity has resurfaced with prices falling below the zone. It is essential to maintain momentum by holding this level. On the upside, the immediate resistance of $2.50 can be seen, where profit-cashing activity can possibly stop any positive results in the short term.
The bullish scenario would be confirmed by a decisive close above the upper trendline of the symmetrical triangle and by growing volume. Thus the projected target of Butterfly of $6.50 becomes plausible as per the historical resistance zones and the technical measured extensions.
Yet caution remains warranted until confirmation. A failed breakout or rejection near resistance could see NEAR retrace toward the triangle’s lower boundary around $2.80. This scenario, while less supported by current momentum signals, illustrates the importance of risk management for market participants.


