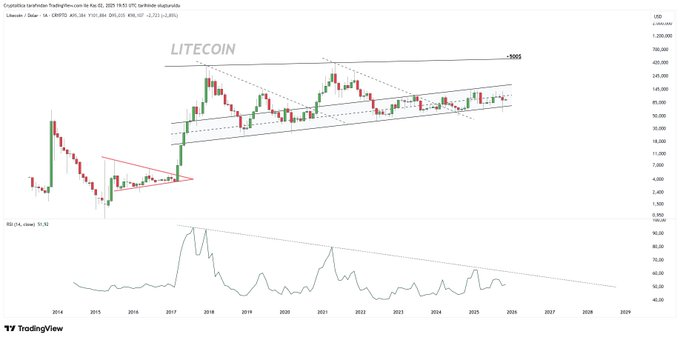
- Litecoin’s multi-year ascending channel reflects stable long-term accumulation between $50–$60 support and $300–$305 resistance.
- RSI compression since 2017 hints at a potential momentum breakout once market volatility begins to normalize.
- Analyst sentiment on social media turns optimistic, suggesting similarities between Litecoin’s setup and XRP’s earlier bullish pattern.
Litecoin (LTC) remains structurally strong in a long-term range of consolidation. However, with the recent volatility, the trend of long term accumulation has not been broken and traders are keeping a closer eye on the momentum indicators to see whether there would be a possible bullish breakout in the future.
Long-Term Channel Formation and Price Structure
The Litecoin (LTC) chart reflects an extended technical evolution, tracing back to 2014. Over multiple market cycles, the cryptocurrency has established a rising channel pattern that underlines steady accumulation and market maturity over time.
The lower boundary of this channel, sitting near $50–$60, has consistently acted as long-term support. Each dip into this region over recent years has invited strong buying interest, signaling investor confidence even through broader risk-off conditions. This repeated defense emphasizes Litecoin’s structural strength.
In the upper limit, the 300-305 is still a resistance zone. There is historical evidence that Litecoin can hardly maintain a consistent position beyond this scope. A breakout farther than this ceiling would be the start of a new level of expansion, and a resurgence of macro-level bullishness.
Technical Momentum and Market Compression
Momentum behavior continues to contract on the Relative Strength Index (RSI), which has trended downward since 2017. Despite price stability, RSI’s long-term compression suggests that energy is building beneath the surface, a pattern that often precedes decisive market moves.
Should RSI break above its descending resistance, it could indicate a fresh momentum cycle forming. This setup mirrors earlier periods in Litecoin’s history when tightening momentum eventually gave way to sharp rallies. The compression between trendlines, both on price and RSI, adds weight to this potential outcome.
Market participants are now paying close attention to sentiment shifts. Analyst @Cryptollica captured this growing optimism on social media, writing, “$LTC BULLISH ITS LIKE XRP >> Booom soon…”. Such comments reflect increasing confidence among traders who see structural similarities between Litecoin’s current setup and XRP’s past bullish breakout pattern.
Short-Term Price Action and Broader Context
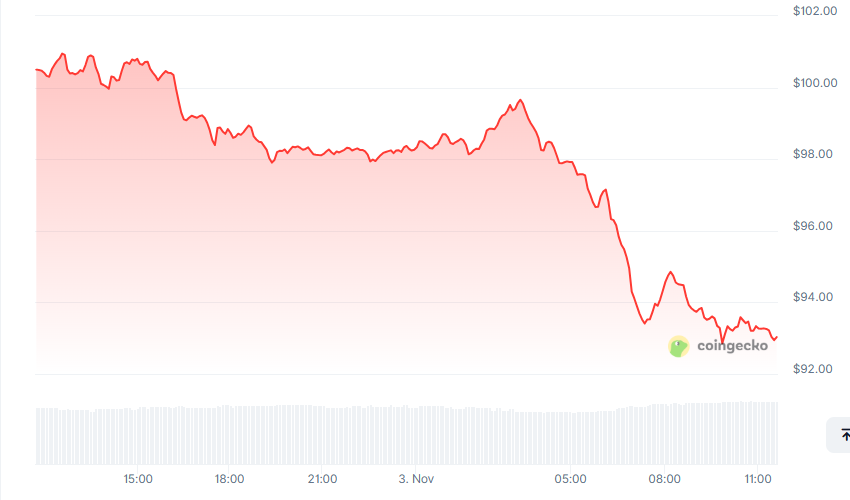
Litecoin retreated significantly during the most recent session by 7.4% to drop to $93.02 upon reaching a momentary peak of $100.82. The 24-hour of trading at around 698 million dollars presupposes additional positioning as opposed to leaving the market hence affirming the involvement of the traders.
Despite the decline, LTC is still bound within the $90-$100 region, which has oscillated between support and resistance for a few months. Price action within this area points to consolidation-a phase where markets absorb liquidity before direction can be determined.
Litecoin has a market capitalization of approximately $7.11 billion and a supply of more than 76.4 million LTC, but is still regarded as one of the most mature legacy cryptocurrencies. This structural transparency and relatively stable network performance often attract renewed participation when sentiment across risk assets improves.


