

Key Insights:
- Hyperliquid’s HYPE token stays near $39, showing a 10% gain over the past month despite a 33% drop from its all-time high.
- Phantom and SafePal wallet integrations allow millions of users to trade HyperEVM assets, broadening market access significantly.
- Market indicators show a potential breakout for Hyperliquid’s HYPE token, with a strong $40 resistance level.
Hyperliquid’s HYPE token remains close to the $40 mark as the market shows signs of tightening liquidity and increasing trading flows. As of now, the token trades near $39, reflecting a modest 2% gain in the last 24 hours. Over the past week, HYPE has fluctuated between $36.50 and $41.18, holding a 10% increase compared to last month, even though it remains down by about 33% from its all-time high of $58.47 in September.
Recent wallet integrations with Phantom and SafePal have introduced new momentum for Hyperliquid. These updates provide access to millions of users, giving a significant boost to trading activity. Phantom, with over 15 million active users, now supports swaps for HyperEVM assets. It allows direct transfers and cross-chain swaps from Solana, Ethereum, Base, and Sui into HYPE tokens. This integration offers a more seamless user experience, bringing in retail traders who may not have interacted with Hyperliquid previously.
Similarly, SafePal, which reaches over 25 million users, launched a full integration of Hyperliquid assets across both its software and hardware wallets. This allows users to take long and short positions with leverage up to 40x, managing HyperEVM assets within the wallet. Both integrations are expected to drive more retail flow into the HyperEVM market, especially as more users gain access to Hyperliquid through their wallets.
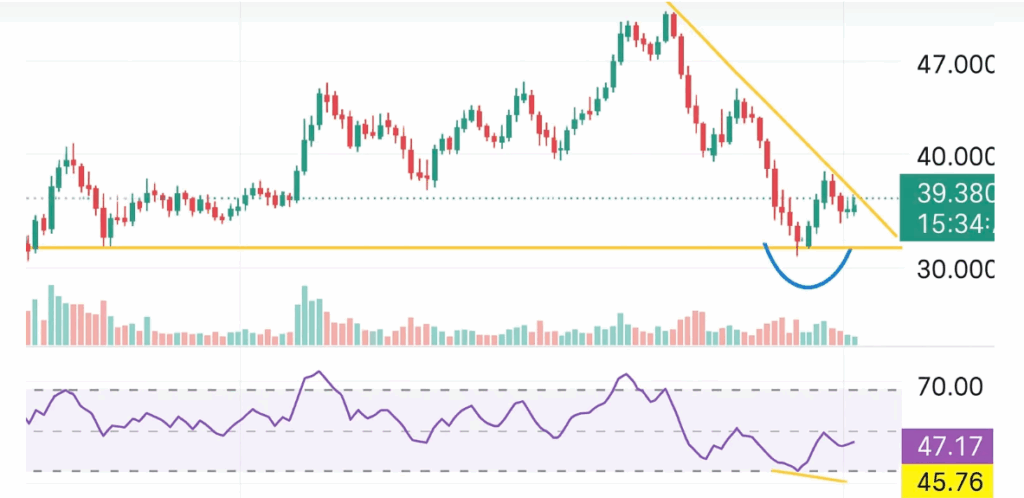
Market Shows Mixed Technical Indicators
Technically, the price action suggests a breakout could be imminent. The daily chart reveals a double bottom formation near the low-$30s, and current price compression between higher lows and lower highs signals the potential for a breakout. Despite a neutral stance from major momentum indicators like the Relative Strength Index (RSI) and the Commodity Channel Index (CCI), there is slight bullish divergence on the RSI. These signs suggest buyers are trying to push the market higher.
The 20-day to 100-day moving averages are sloping downward, indicating the broader market trend remains bearish. However, the shorter-term 10-day averages show an upward trend, which could signal a shift in sentiment. The 200-day exponential moving average (EMA) near $38 serves as support, offering a solid base for potential upward movement.
Looking Ahead to Breakouts and Risks
If the price breaks above the $40 mid-range, the market could target the upper range between $44 and $50, where previous breakouts have failed. A failure to maintain support at the $38 to $39 range could signal a return to the lower $30s, which would mark a continuation of the downtrend.


