
- Horizen’s price has dropped sharply, nearing the lower boundary of a symmetrical triangle on the 4H chart.
- The market shows reduced trading activity, suggesting uncertainty among participants after recent token contract adjustments.
- Analysts warn that losing the $12.00 level could send ZEN toward the $10.30 support region seen earlier in October.
The volatile trading week has led Horizen (ZEN) to a critical consolidation phase, and the asset is currently testing the lower limit of its symmetrical triangle figure. The market data shows a sudden drop in price and trade volumes, which is indicative of the increased reluctance of traders to commit to the new significant movement.
Horizen Faces Pressure as Market Tests Triangle Support
Horizen (ZEN) is at a crossroad following an increase in volatility during the past sessions. The asset is converging in a symmetrical triangle in the four-hour chart, which indicates the balance between the purchasers and the vendors with decreasing momentum. This trend has usually preceded a break out of decisive nature and traders are attentively varying which side they will assume power next.
Recent data shows that $ZEN’s market capitalization has fallen to about $206.51 million, following a 20% intraday drop that pushed its price down to $11.80 from highs near $15. This correction suggests the asset may be entering a short-term cooling phase after a strong rally earlier in the month. Meanwhile, trading volume has declined by more than 58%, a sign of waning speculative activity as market participants step back to reassess direction.
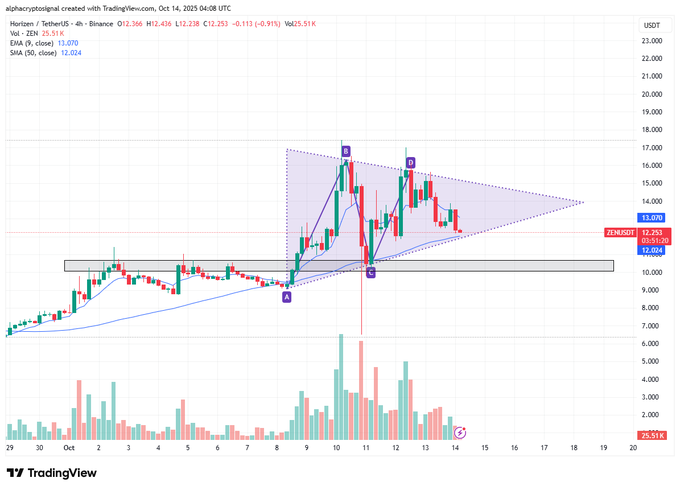
Alpha Crypto Signal described this phase as “a healthy consolidation” within the triangle’s structure, with the price approaching the lower support zone around $12.00. This level is now vital for maintaining structure integrity. Should $ZEN manage to hold this area, a rebound toward $14.50–$15.00 could unfold. However, if the zone breaks, traders may see a deeper pullback toward $10.30.
Technical Structure Points to a Decisive Move
The symmetrical triangle formed after an impulsive rally from roughly $9.50 to $17.50, reflecting strong early buying interest before momentum started compressing. Since then, $ZEN has produced a pattern of lower highs and higher lows — a typical formation of indecision before volatility expansion.
From a technical perspective, $ZEN trades slightly below its 20 EMA while staying just above the 50 SMA, which sits close to the triangle’s lower boundary around $12.00. This confluence zone represents the most critical support level for the short term.A successful defense would restore the bullish tone and lead to the upper triangle resistance at or near the level of $15.00 with the possibility of the breakout reaching up to $18.00-19.00.
Quite the contrary, a firm close below $12.00 on volume would nullify the pattern, and set in motion a shift to the demand region of $10.30-10.80. This is the range that acted as a critical accumulation base in the last upward leg, and traders are keen on this range to determine whether the broader bullish structure is still in place.
Sentiment and Volume Reflect Market Uncertainty
While the technical setup dominates attention, sentiment indicators show a mixed landscape. The Vol/Mkt Cap ratio at 60.72% indicates steady liquidity despite reduced enthusiasm, suggesting that active traders remain engaged even as broader participation fades.
To provide some history to recent volatility, Horizen has recently undergone a 1:1 token swap to a new contract – an occurrence that typically causes short-term instability. These changes can result in mix-ups between exchanges and wallets, which can result in transient volatility spikes as liquidity attempts to realign.
Community sentiment, reflected in posts like trader Eymarde’s, shows cautious optimism. His note that “economic events can disrupt all setups” captures the prevailing mood among participants waiting for confirmation signals. Many now view volume expansion and clear breakout candles as essential cues for re-entry.
If $ZEN stabilizes above the $11.00–$12.00 region and regains upward momentum, short-term recovery toward $13.00–$14.00 could materialize. Until then, traders under the Alpha Crypto Signal outlook remain alert for structural validation as Horizen navigates this tightening consolidation phase.


