- HBAR lost its critical $0.228–$0.232 support, now turning the zone into resistance under strong selling pressure.
- Derivatives volume fell 34.03% to $277.18M, while open interest declined 4.08% to $410.18M.
- Long liquidations totaled $473.21K in 24h, showing bulls punished despite higher long-to-short ratios.
Hedera Hashgraph (HBAR) is trading below a key support zone, as weakening volume and derivatives data reflect increasing bearish control. Market signals indicate caution, with long traders exposed to heavy losses despite maintaining majority positioning.

Breakdown Below Support Zone
The HBAR/USDT 4-hour chart on Binance reveals a confirmed breakdown below the $0.228–$0.232 horizontal support level. This area had previously served as a base for repeated retests but has now been breached, leaving short setups in play.
Alpha Crypto Signal (@alphacryptosign) noted that unless this gray zone is reclaimed as support, further downside remains very likely. Price action continues to respect a descending trendline from early August, which has consistently rejected bullish recovery attempts.
HBAR as of writing, trades near $0.2246, marking a 0.67% daily decline and a 9.13% loss over seven days. Immediate targets lie toward $0.210 and $0.200, levels where buyers may attempt to reestablish stability.
Derivatives Market Signals Weak Momentum
The derivatives market reinforces this bearish outlook. Volume dropped by -34.03% to $277.18 million and open interest dropped -4.08% to $410.18 million. These drops are indicative of low activity and lower liquidity conditions.
Such simultaneous declines in both volume and open interest often suggest waning conviction from both buyers and sellers. In HBAR’s case, this aligns with the spot market breakdown, where momentum now favors sellers.
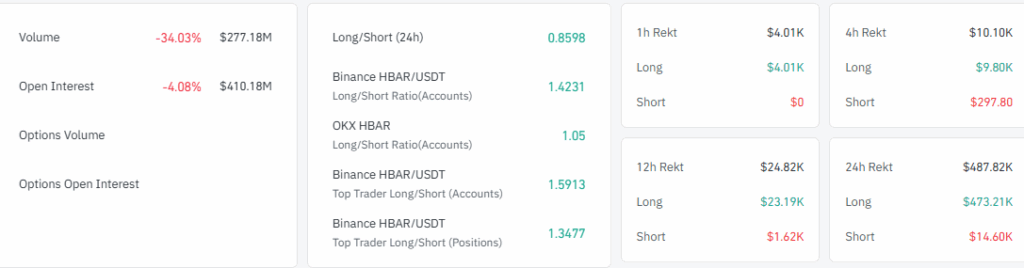
Despite weakening activity, trader sentiment shows mixed signals. The global 24-hour long/short ratio is $0.8598, suggesting a tilt toward shorts, but top exchange data paints a different picture.
Long Traders Face Heavy Liquidations
On Binance, the long/short ratio by accounts stands at 1.4231, while on OKX the ratio is 1.05, reflecting majority long exposure. Top traders are even more bullish, with ratios of 1.5913 by accounts and 1.3477 by positions.
However, liquidation figures reveal a different story. In the past 24 hours, long liquidations totaled $473.21K, while shorts lost only $14.60K. This shows that despite optimism from long traders, price action has consistently punished them.
Across shorter timeframes, the imbalance remains. In 12 hours, $23.19K worth of longs were liquidated against just $1.62K in shorts. This consistent trend signals that bearish momentum is outweighing bullish positioning in the derivatives market.


