
- Gala trades inside a descending triangle, with buyers defending $0.0155–$0.0160 but sellers capping gains near $0.0166.
- Rising volume against a contracting market cap signals distribution pressure, though buyers reclaimed ground after a false breakdown.
- Contract migration notice introduces short-term volatility, requiring traders to monitor liquidity and technical boundaries closely.
Gala remains confined within a descending triangle on the 4H timeframe, with traders closely watching the critical $0.0155–$0.0166 band. While buyers defended support after an earlier breakdown attempt, the structure continues to lean toward downside pressure.

Descending Triangle Pressures Price Structure
According to Alpha Crypto Signal (@alphacryptosign), GALA trades within a descending triangle, a pattern associated with bearish continuation. Price action has compressed between horizontal support near $0.0155–$0.0160 and lower highs from the descending trendline.
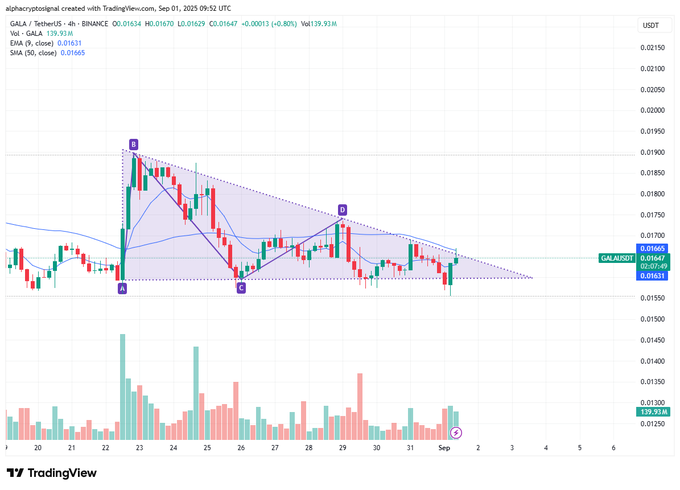
A false breakdown occurred earlier, but the market quickly reclaimed support, showing that buyers remain active around key demand levels. Despite this defense, price has been repeatedly rejected near the trendline, keeping the overall structure under pressure.
Short-term moving averages, including the EMA 9 and SMA 50, sit overhead and act as dynamic resistance. Volume contraction during consolidation further signals that a decisive breakout or breakdown is likely approaching.
Short-Term Pivots Define Bullish or Bearish Path
The immediate pivot for buyers lies at $0.0166, where a clean 4H close could flip the structure bullish. This would enable price to probe around $0.0170-175, breaking the bearish triangle thesis and causing a short cover.
Any failure to maintain above this pivot, however, leaves downside risk intact. Bearish momentum would be proven by a breakdown below $0.0155, revealing $0.0150 first. Additional weakness may push the losses to between $0.0140- $0.0135 which are previous demand areas.
Gala as of writing stands at a price of $0.01590, which is a 2.65 change of fall. It has a market capitalization of $729 million and a 24-hour trading of $98.29 million, both increased by 8.94%. The volume to market-cap ratio of 13.52% is an indicator of high participation.
Market Liquidity and Contract Migration Catalysts
Trading activity shows intraday lows near $0.0150, followed by recovery toward $0.0158–$0.0160 as buyers absorbed selling pressure. The intraday high at $0.01647 now serves as immediate resistance in the near term.
Supply dynamics reveal 45.83 billion tokens in circulation against a capped supply of $50 billion. With FDV at $794.26 million and most tokens already unlocked, dilution risk remains limited in the short run.
A migration notice to a new contract address introduces a fresh catalyst. Such transitions can create temporary volatility as liquidity shifts across platforms. Observers should monitor contract-related updates alongside technical levels to gauge near-term direction.


