
- FET continues to trade below $0.27, sustaining its bearish structure within a defined descending channel on the 4H chart.
- Volume decline during rallies and resistance near EMA-9 indicate weakening buyer conviction and persistent selling pressure.
- A confirmed breakout above $0.33 could signal a trend reversal, but the market remains cautious amid ASI merger developments.
Fetch.ai (FET) continues to be under a visible selling pressure with the token maintaining a downward trend on several timeframes indicating a persistent market correction. The present trading pattern indicates wary trading as investors seek price direction assurance during the ASI merger transition.

Market Structure Signals Sustained Pressure
Fetch.ai (FET) is experiencing selling pressure, as it is falling, trading in a well established bearish channel. The trend of the token on the 4-hour chart continues to portray low highs and lows, which is an indication of weakness in the market. Latest CoinMarketCap statistics show that FET is currently at approximately $0.2612, having shed 10.58% in 24 hours and resting on a market cap of $619.39 million.
The trading volume within the same duration is $148.8 million, down by 38.2%, reflecting reduced participation after an experience of high volatility. A Volume-to-Market Cap ratio of 24% supports the notion that while liquidity remains steady, speculative activity has cooled. The pattern observed in recent sessions indicates consistent rejection near the midline of the channel, where price faces resistance from short-term moving averages.
This technical alignment confirms what market observers describe as a controlled descent, with price oscillating rhythmically within defined bounds rather than collapsing sharply. Such movement reflects continued distribution, as traders gradually reduce exposure while awaiting clearer market catalysts.
Technical Outlook Reflects a Controlled Descent
According to Alpha Crypto Signal’s analysis shared on X, FET continues to trade within its descending structure, meeting consistent resistance near the EMA-9 and the 50-period SMA. The value of the price between $0.27 and $0.30 is also a key rejection zone as it acts as a limit stopping the prices to climb upwards. Bearish pressure will prevail until price maintains above the upper limit of the channel at around $0.33.
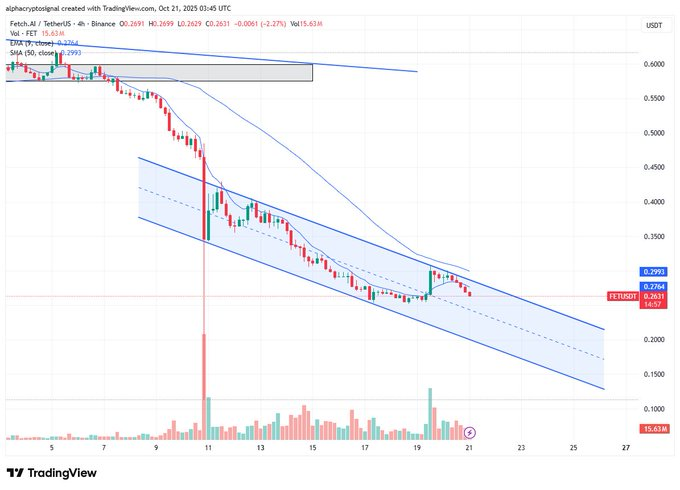
The lower channel boundary around $0.18–$0.20 serves as the next potential support zone. This area aligns with prior liquidity accumulation seen in May, where buyers briefly regained control. Failure to maintain current levels could lead price action toward that zone once again.
Volume analysis reinforces this cautious tone. Downward moves have been accompanied by higher trading volume compared to modest rebounds. This pattern signals that sellers retain control, while buyer conviction fades at higher levels. Unless volume expansion accompanies a breakout, upward moves may remain corrective.
Broader Context and Market Sentiment
FET market sentiment is driven by news about the Superintelligence Alliance, a collaborative effort between Fetch.ai, Singularity NET, and Cudos. The creation of a unified AI token, ASI, is optimistic but uncertain. While the long-term vision has attracted attention, near-term trading reflects hesitation as investors seek clarity on the consolidation process.
On social platforms, traders have speculated about a possible short-term rebound, noting that FET could be finding temporary support near the $0.25 psychological level. Some analysts suggest that if the price can close above the descending trendline with strong volume, momentum could shift toward $0.35–$0.40.
For now, market behavior remains cautious. FET continues to move within a confined range, balancing between technical resistance and fading volume. The overall structure signals patience among market participants, awaiting either confirmation of a breakout or a further test of lower channel support.


