

- Grayscale’s GBTC saw a $68M outflow as iShares and Fidelity ETFs quietly gained, highlighting a sharp divergence in investor flows.
- Ethereum outpaced Bitcoin last week, with ETH/BTC rebounding from multi-year lows and technicals signaling renewed momentum.
- Despite daily selloffs, BTC and ETH ETF assets continue to grow, signaling long-term accumulation amid short-term volatility.
Bitcoin and Ethereum exchange-traded funds (ETFs) recorded net outflows on May 13, with $27.9 million and $10.83 million exiting, respectively. Grayscale led the day’s losses as investor sentiment shifted amid renewed volatility across digital asset markets.

BTC ETF Flows Show Grayscale Pressure, iShares Growth
According to a post by Lookonchain, ten Bitcoin ETFs posted a combined daily net outflow of 268 BTC valued at $27.9 million. Grayscale’s GBTC led with a single-day outflow of 655 BTC worth $68.16 million, reducing its total holdings to 188,604 BTC. In contrast, BlackRock’s iShares Bitcoin Trust (IBIT) added 682 BTC, bringing its total to 625,736 BTC.
The seven-day trend showed a more bullish picture, with cumulative net inflows of 4,886 BTC worth $508.82 million. Notably, Fidelity’s FBTC added 1,091 BTC over the week despite losing 109 BTC on the day. ARK 21Shares’ ARKB gained 527 BTC in seven days, signaling selective accumulation even amid broader selloffs.
ETH ETF Outflows Mount Amid Fidelity Selloff
Nine Ethereum ETFs reported a daily net outflow of 4,189 ETH worth $10.83 million, with Fidelity’s FETH leading the decline. FETH lost 3,247 ETH on the day, contributing to a seven-day reduction of 22,480 ETH. Its current holdings stand at 400,916 ETH valued at approximately $1.04 billion.
Simultaneously, other market indicators suggest a different trend. The Grayscale Ethereum Trust (ETHE) also saw daily and weekly outflows of 233 ETH and 543 ETH, respectively, while its Mini Trust added 1,493 ETH over the week. Total ETH ETF holdings now stand at 3,443,723 ETH, valued at $8.9 billion.
Technical Indicators Signal ETH/BTC Momentum Shift
Ethereum’s outperformance against Bitcoin has gained traction, fueled by relative strength in ETH/BTC trading activity. According to a post by Carl Moon, Ethereum surged 44.32% in the past week compared to Bitcoin’s 6.94% gain. The ETH/BTC ratio rebounded from a multi-year support zone, suggesting renewed investor confidence in Ethereum.
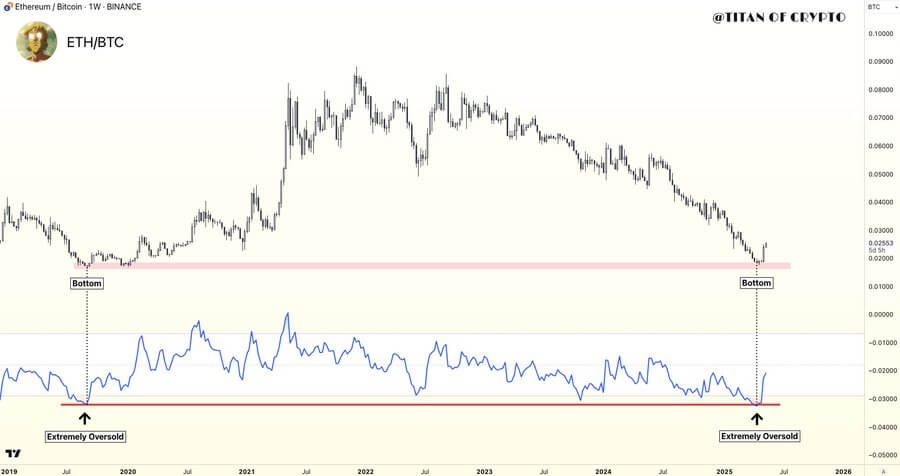
Titan of Crypto pointed to a confirmed double bottom in the ETH/BTC weekly chart, with RSI indicators signaling oversold conditions similar to 2019. This technical structure aligns with previous bullish cycles, reinforcing the likelihood of a continued ETH-led altcoin rally. The ETH/BTC pair now shows early signs of recovery, following consistent underperformance through 2024.
Macro Flows and Asset Growth Reflect Diverging Sentiment
Data from SosoValue charts show Bitcoin’s total ETF assets rising to $122.92 billion despite short-term net outflows. Inflows peaked at over $500 million earlier in 2024, while outflows exceeded $1 billion during market corrections. The current BTC price stands at $104,792.22, supported by long-term asset growth trends.
Ethereum’s ETF ecosystem followed a similar but more volatile path. Total net assets rose from $7 billion in mid-2024 to $9.27 billion by May 2025. Price fluctuations saw ETH peak above $3,000 in late 2024, then correct to $2,690.94 amid early 2025 selloffs before stabilizing on renewed buying activity.


