
- Ethereum moves toward a volatility hinge as Bollinger Band compression follows months of declining momentum.
- ETH futures and spot activity show rising participation as exchanges record strong volume and open interest shifts.
- An abrupt 24-hour turn puts Ethereum on a key mid-band convergence that can inform the next more global trend.
Ethereum is at the critical stage, as the price movement coincides with a narrowing of Bollinger Bands and a decrease in intraday momentum. Market data across spot and derivatives now reflects shifting participation during a period marked by lower volatility and directional uncertainty.
Volatility Compression Forms a Key Technical Pivot
Ethereum’s 2-day structure shows a maturing volatility cycle as the Bollinger Bands shift from summer expansion into prolonged tightening. Price now trades near the middle band, which functions as a gauge of trend balance. This region has served as Ethereum’s pivot through prior multi-week phases.
Cantonese Cat noted that candles no longer hold above the mid-band as they did during the July–August advance. The shift began in September, and selling pressure through October pushed the asset toward the lower range near $2,800. The bands widened briefly during that drop before compressing again through November.
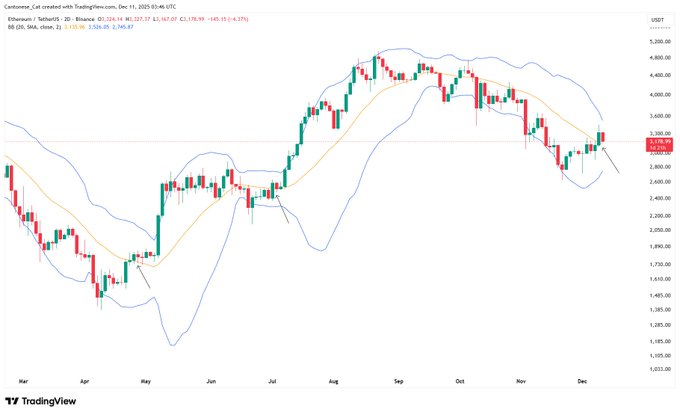
Recent lower-band pierces formed a rebound structure similar to earlier phases observed earlier in the year. These brief extensions below the band often occur near stretched volatility zones. Ethereum’s return toward the middle band now creates a crucial point between renewed recovery attempts and continued compression.
Market Structure Shows Liquidity Growth Across Exchanges
The broader multi-dataset chart reflects an evolving liquidity profile across spot and derivatives markets. ETH price climbed from late December into April before declining into early autumn, with volume spikes accompanying major swings. Several high-volume surges in August and September accompanied heavy two-direction movement.
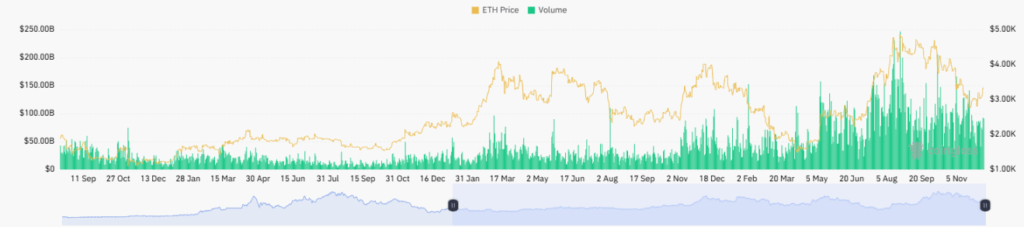
Cumulative volume in the lower blue region drifted upward through the mid-year period. This trend formed even as price flattened, suggesting sustained trader engagement. The pattern aligned with Ethereum’s rebound into November, where renewed participation supported recovery attempts.
Across futures markets, CME leads ETH open interest above $8.4B, signaling strong institutional demand. Offshore venues such as HTX, OKX and MEXC account for substantial retail participation. This distribution shows how trader types position differently across platforms.
Short-Term Price Pressure Tracks a Sharp Downward Reversal
Ethereum at the time of writing, is trading at $3, 206.58 following a sharp decline over the previous 24 hours, which came on top of an intraday high of $3,432.93. Price action shifted rapidly from a rising structure into a pronounced slide toward the $3,176 zone. The reversal created a sequence of lower highs as selling pressure accelerated.
A small rebound formed near $3.20K, though it did not recover prior intraday strength. The move reflected reduced confidence after the late session drop. Trading volume reached $35.7B, suggesting heavy engagement from both sellers and short-term buyers.
Market cap stands at $387B, and circulating supply remains near 120.7M ETH. The interaction between 24-hour weakness and the mid-band zone on the 2-day chart shapes the current volatility pivot. Ethereum now trades near a level that may influence whether the next broader expansion forms toward the upper band or retests recent support.


