

- The ETH/BTC ratio rebounded 38% off a multi-year low, signaling reduced sell pressure and renewed accumulation.
- Ethereum’s breakout above $3,700 mirrors Bitcoin’s 2020 rally, with projections pointing toward a potential $7,800 target.
- ETF demand and inflow data suggest a structural pivot for Ethereum, with historical lows hinting at a long-term reversal.
Ethereum may have reached a pivotal bottom against Bitcoin, with the ETH/BTC ratio rebounding 38% from its multi-year low near 0.045, according to a post by CryptoQuant.com. The move has sparked renewed optimism for a potential Altseason, as institutional demand rises, ETF exposure increases, and sell-side pressure declines. The rally coincides with a key trendline break that could mark the end of Ethereum’s prolonged underperformance versus Bitcoin.
The ETH/BTC chart, which spans from 2017 to May 2025, illustrates three major phases: early outperformance, consolidation, and a steep 2022–2025 decline. Ethereum’s local bottom, now annotated at May 2025, mirrors the 2019 and 2020 lows near the 0.016 region, historically pivotal zones for ETH reversals. These areas have historically marked points of strength for Ethereum relative to Bitcoin.
ETF exposure and custody data signal reduced pressure
Ethereum’s bullish rotation has been further supported by a sharp drop in the ETH/BTC exchange inflow ratio, now at its lowest in five years. The falling inflow ratio, averaging 0.15, suggests significantly reduced ETH selling pressure compared to Bitcoin. The data identifies ETH accumulation zones near this threshold, which historically precede major ETH/BTC reversals.
Alva Commentary added that Ethereum has outpaced Bitcoin in recent sessions, rallying over 37% after the Pectra upgrade. The analyst noted that while Bitcoin remains the macro hedge, its technical indicators are weakening, with the MACD flashing bearish and ETF demand appearing stagnant. Ethereum, in contrast, is drawing momentum from renewed DeFi, NFT, and ETF-related narratives.
Pattern symmetry shows ETH mirroring BTC’s 2020 breakout
Simultaneously, other market indicators suggest a different trend is underway. A comparative macro chart from Crypto GEMs illustrates Ethereum’s current breakout structure as nearly identical to Bitcoin’s 2020 pre-bull run pattern. ETH’s breakout above $3,700 follows a two-year re-accumulation phase and mirrors BTC’s 2019–2020 structure, complete with identical trendline tests and breakout triggers.
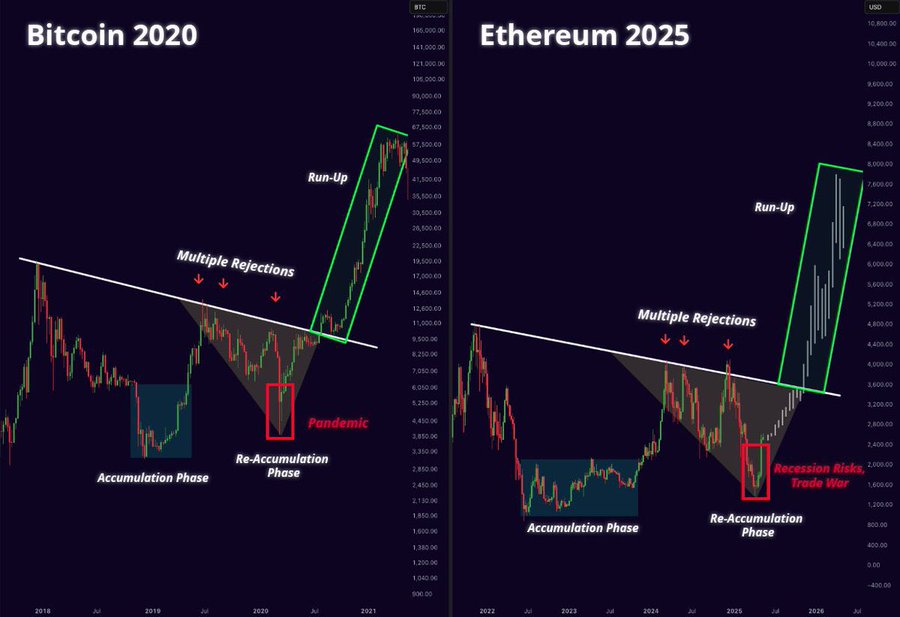
The analyst mapped Ethereum’s price trajectory onto a logarithmic structure, with the projected target zone extending toward $7,800. The historical symmetry includes red arrows marking each failed breakout, horizontal compression during accumulation, and vertical green channels denoting breakout runs. The analysis places ETH’s setup as a five-year lagging analog to BTC’s last major breakout cycle.
Historical lows and moving averages point to a structural pivot
The ETH/BTC pair remains below its 365-day simple moving average, which has been sloping downward since late 2022. However, the expanding gap between the ratio and its moving average, combined with surging momentum, mirrors prior ETH recoveries. These setups in 2019 and 2020 preceded long-term reversals, marked by strong institutional inflows and DeFi adoption.
CryptoQuant’s annotated chart includes key macro events like the Merge and ETF speculation windows, providing a broader context for ETH’s multi-year trend. With the ratio now off historic lows, analysts are closely watching for confirmation of a sustained structural reversal. ETH/BTC currently trades near 0.062, with growing trading volume reinforcing short-term bullish bias.


