
- Ethereum slips after a clear trendline break, with hourly structure showing an abrupt shift toward lower support ranges.
- A 24-hour long fall draws ETH down to the mid-range of $2,800 as compression yields to necessary and strong liquidation selling.
- Open interest cools across derivatives as traders unwind leverage during a broader repositioning phase.
Ethereum moves through a decisive structural shift as hourly support levels fail and market activity turns defensive. Short-term volatility expands while traders monitor key zones to determine whether the pullback continues or finds a stable base.
Trendline Break Marks a Structural Turning Point
Ethereum price action moved through an ascending trendline that had supported multiple sessions of higher lows. The level was tested repeatedly and acted as a dynamic base before losing strength. The market’s push beyond $3,050 failed to extend, forming a lower high.
The shift gained attention when ZAYK Charts stated that ETH confirmed a clear trendline breakdown followed by an eight percent decline. The pattern showed compression along the trendline before a strong candle breached support and accelerated momentum. The move revealed weakening internal strength.
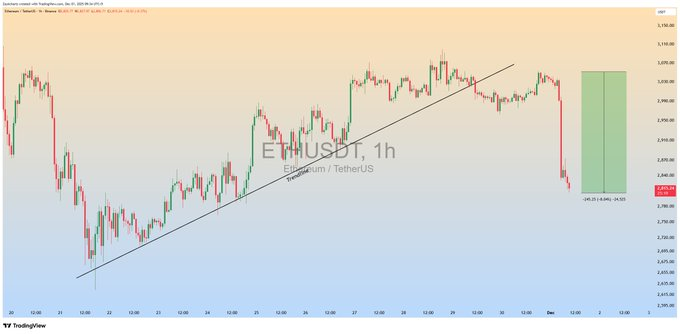
After the breakdown, Ethereum slid rapidly toward the $2,900 region. The decline exposed earlier liquidity build-ups while sellers gained control through a series of long-bodied candles. Price action returns to a zone where the market will assess whether a wide correction develops.
24-Hour Chart Shows Rapid Expansion After Prolonged Compression
The 24-hour ETH chart displayed a long consolidation phase near $3,000 where volatility remained low. The narrow band between $3,000 and $3,020 suggested a temporary balance. Market conditions stayed tight until early trading hours triggered a wide shift.
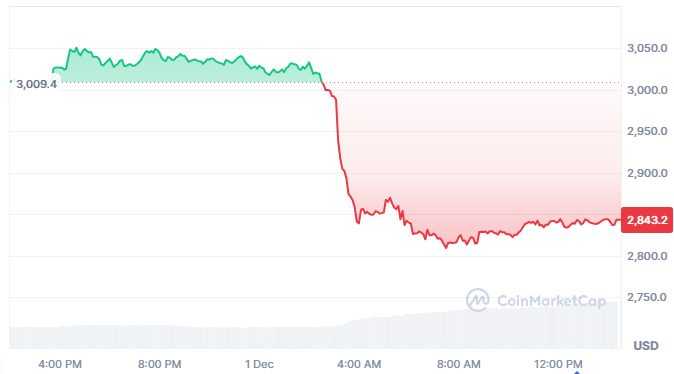
A sharp move then pulled price toward $2,880 as stops triggered during the breakdown. Attempts to recover above $2,900 lacked strength and resulted in shallow bounces. Extended red candles on the chart showed sustained pressure with limited counterflow.
Despite the decline, commentary noted that spot ETH ETFs now hold $29B in assets. This detail points to broader accumulation patterns even as short-term technical conditions soften. The divergence between market structure and long-term flows adds an important layer to near-term analysis.
Open Interest Trends Reveal a Broader De-Leveraging Phase
The combined chart of Ethereum price and open interest shows a clear relationship between leverage cycles and price movement. Early segments presented stable open interest during modest trends, suggesting constrained speculative exposure.
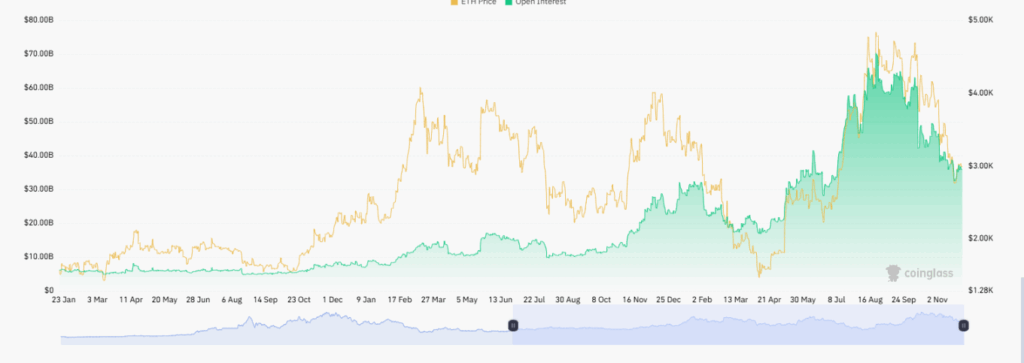
Open interest later expanded as ETH advanced toward the $4,000–$4,800 area. Leveraged long positions grew as momentum increased during the run. The expansion aligned with stronger enthusiasm across derivatives markets.
Recent data shows both price and open interest moving lower. This pattern indicates traders are reducing exposure and removing leverage after extended positioning. The process supports stabilization efforts while the market evaluates whether a new accumulation region can form.


