
- ETH struggles below a multi-week descending trendline as traders monitor a move toward $3,285 resistance.
- Funding rates show neutral sentiment, suggesting caution despite recent attempts to recover from early-November lows.
- Analysts observe fading rallies and weak momentum as the $2,230 support zone becomes an important market level.
Ethereum continues to show weakening structure as its price action trends lower within a broad downward formation. The asset faces cautious sentiment from derivatives traders while approaching key resistance and potential deeper support levels.
Market Structure Shows Continued Weakness
Ether trades at $3,038.23 at the time of writing, following a 4.09% drop on a daily basis and a small weekly increase of 0.17%. Its larger direction is still squeezed under a multi-week downward line which has tightened every recovery period. Price action stays controlled by persistent sell pressure.
A recent post from CRYPTO Damus notes that Ethereum’s daily chart carries a heavy tone as rallies lose strength near the descending boundary. The resistance at $3,285 forms a crucial level tied to earlier support that shifted into resistance. This zone continues to attract short interest during each attempted upswing.
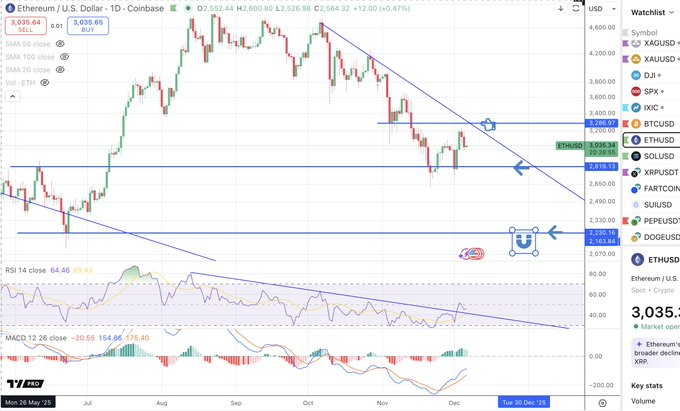
Lower support between $2,230 and $2,280 remains a visible magnet after repeated tests in recent months. Each return to this area shows weakening reaction strength, and market structure still forms lower highs and lower lows. The broader sequence supports a gradual drift toward deeper support.
Momentum Indicators Signal Ongoing Fatigue
RSI attempts to recover have remained muted, turning down before reaching firm bullish territory. The indicator continues to move inside a longer-term descending channel. This pattern reflects reduced strength during recent recovery attempts and limited follow-through.
MACD presents a similar tone, showing a weak developing cross as histogram expansion remains shallow. The formation suggests a relief phase instead of a broader shift in market direction. Each wave upward lacks the conviction needed for a sustained trend change.
As Ethereum moves toward the $3,285 resistance area, momentum remains unstable. Traders watching these signals continue to view small recoveries as temporary rallies instead of trend reversals. This behavior aligns with a market waiting for a clearer directional catalyst.
Derivatives Market Positions Show Caution
The OI-Weighted Funding Rate chart adds another layer to current sentiment. Funding held slightly above neutral through early October, suggesting mild pressure from long positions without firm confidence from bullish traders. This period set the tone for a cautious environment.
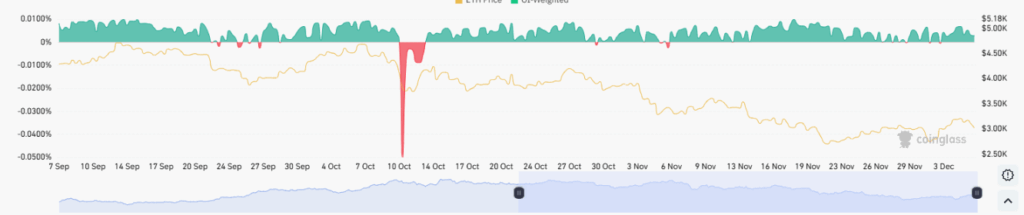
Mid-October produced a strong negative funding spike as shorts gained control during a sharp price drop. The move reflected a rapid shift into defensive positioning and became a sentiment reset point. Funding later returned to balanced levels as markets stabilized.
Recent weeks show funding oscillating near neutrality with only light positive readings. This behavior supports the idea that traders are not fully committing to bullish positions. With sentiment steady but cautious, the broader structure continues to lean toward measured downside risk while Ethereum approaches the $2,230 region once again.


