

Key Insights
- Ethena loses 20% in seven days and falls 100% from its September peak, now trading near $0.31.
- Whale wallets reduce ENA holdings by 34%, triggering wider market selling and pushing prices further down.
- Token unlocks added over $70M in supply this week, increasing sell pressure amid muted market demand.
Ethena’s market capitalization has dropped from $3.7 billion to $2.3 billion, reflecting a sharp decline in investor sentiment. The altcoin is now trading around $0.31, marking a 20% loss over the past week and nearly 100% below its September high.
The price experienced a brief uptick on November 6 following Robinhood’s announcement to list the token. However, this rebound was short-lived. Price action resumed its downward trend shortly after, weighed down by a major token unlock event.
Token Unlock Intensifies Selling Pressure
On November 5, 171.88 million ENA tokens, valued at approximately $54.88 million, entered circulation. This followed another unlock of $15.7 million worth of tokens on November 2. These events have added significant supply to the market, applying downward pressure on the asset.
Currently, there are 7.42 billion ENA tokens in circulation. Around 70% of these remain with early investors and the Ethena development team. This high concentration raises caution among market participants, as further profit-taking could accelerate the downturn.
Whale Activity Contributes to Decline
Blockchain analytics data from Nansen indicates a notable decline in whale-held balances. As of October 31, whale addresses held 65.24 million tokens. That figure has since dropped to 43.06 million, marking a 34% decrease. This sell-off trend has likely influenced retail investor behavior, adding to the broader decline.
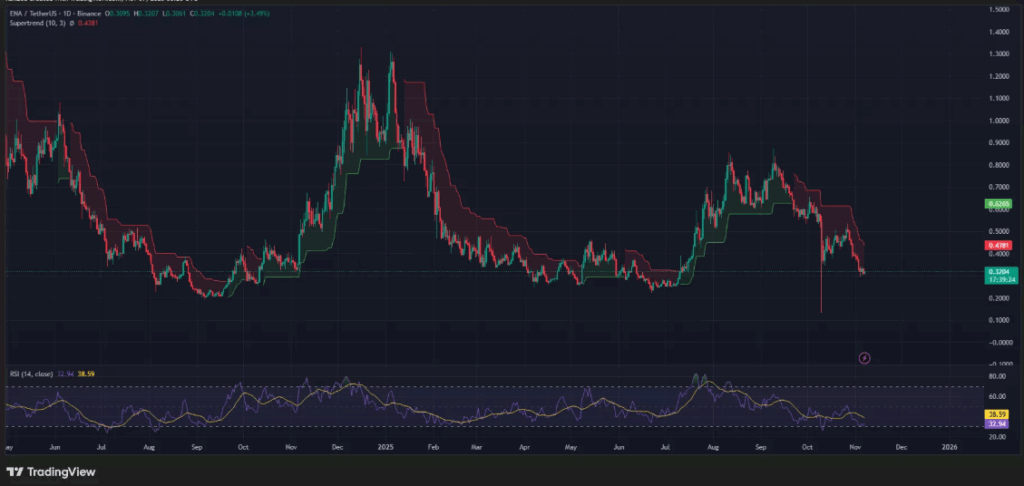
Technically, Ethena’s price continues to move within a descending parallel channel, maintaining a consistent bearish trajectory since early September. Indicators such as the Supertrend have turned red, reinforcing the negative outlook.
Death Cross Nears on Chart
The 50-day simple moving average is on the verge of crossing below the 200-day SMA, a bearish technical signal known as a “death cross.” Historically, this pattern points to deeper losses.
The Relative Strength Index currently sits near 32, close to the oversold level. While a short-term recovery remains possible, price action suggests continued risk toward the $0.197 level. Resistance appears firm around the $0.47 mark, which aligns with the 200-day SMA and the 38.2% Fibonacci retracement level.


