

Key Insights
- Dogecoin moved toward a major support zone as rising volume signaled stronger activity while traders monitored reactions across key technical regions.
- Market structure showed steady lower highs and lows, highlighting pressure near resistance areas that continued to restrict recent upward movements.
- Increased participation shaped expectations as Dogecoin traded near support levels that influenced earlier reversals and guided the latest technical readings.
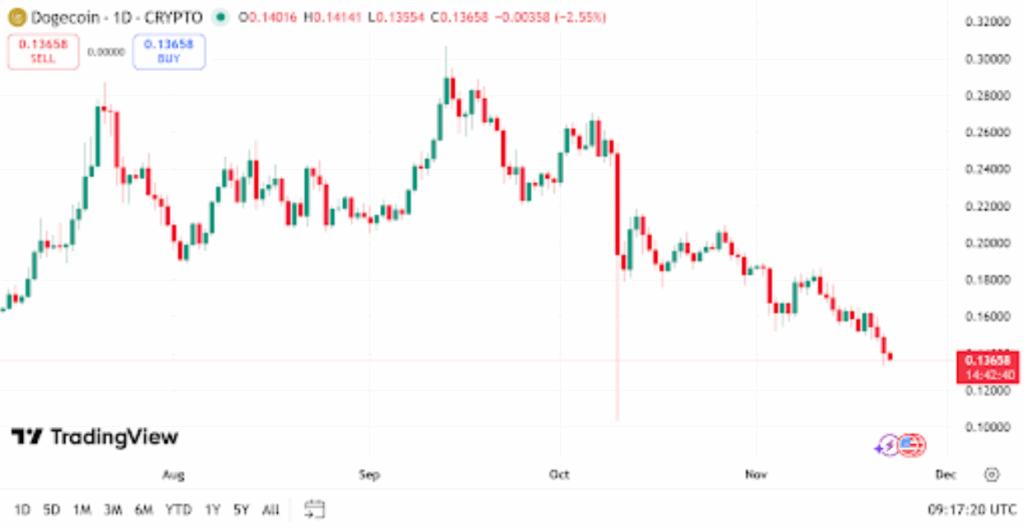
Dogecoin moved toward a key trading zone as volume increased across major exchanges. The token hovered near the 0.136 dollar level after a steady pullback, and traders monitored how rising activity shaped the latest market behavior. Social data added to the attention around Dogecoin’s near term direction.
The daily chart showed a clear pattern of lower highs and lower lows that guided the recent slide. Price moved away from its October range and settled near the 0.13 dollar region. The candles formed tight bodies with limited wicks, which showed reduced momentum as the market paused near support.
Resistance Caps Recent Attempts
The $0.15 area capped the latest recovery and pushed the market lower again. Sellers maintained control over this zone and prevented continuation. Another notable level stands near $0.12, which marked earlier reversals during past cycles. A broader support range around $0.10 remains on the chart.
A post from the X account dogegod stated that Dogecoin’s trading volume crossed 3.4 billion dollars in a single day. The rise in activity appeared as the price moved toward support, and traders reviewed the behavior to understand whether stronger participation might shape the coming sessions.
Earlier Sessions Showed Sharp Candles
Recent candles included wide intraday swings with one marked by a long downward wick. These movements often emerge during periods of increased activity. Traders reviewed this behavior to evaluate whether strong reactions could signal shifts within the current trading phase.
Quantity expanded as Dogecoin approached a level that guided earlier reactions. Participation increased from both sides of the market, and analysts noted that activity near major zones often influences short-term changes. These observations formed part of a broader technical reading across the market.
A descending trendline continued to limit upward movement. Price attempted to move above $0.15 several times but failed each time. Another resistance zone near $0.18 shaped earlier rejection points and remained significant within the current outlook.


