
- Dogecoin tests micro support near $0.136 as traders watch for a potential structural shift.
- Technical readings show a risk of a broader wave 2 retracement despite short-term support.
- Weekly structure displays a repeating cycle of pumps and complex pullbacks forming a pivotal setup.
Dogecoin approaches a critical technical zone as recent price action reflects a challenging balance between short-term stability and broader corrective risk. Market participants are monitoring whether the current structure can sustain support or extend its weekly pullback.
Micro Support and Short-Term Structure
Dogecoin is trading at $0.139 at the time of writing, a slight drop of 0.42% in the last 24 hours The price chart indicates a drop of 6.93% over the last seven days as the price attempts structural support at $0.136. This area functions as a micro zone that determines whether the short-term outlook can stabilize.
A shared update from More Crypto Online notes that DOGE must reclaim the upper channel boundary to keep the current bullish structure active. The analysis mentions a yellow scenario, which remains valid as long as the micro support does not break decisively. This structure focuses on the early stages of a possible wave progression that relies on holding recent lows.
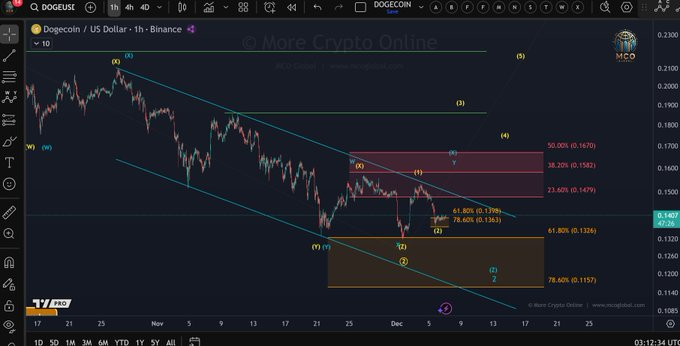
The chart presents Fibonacci levels at 61.8 percent and 78.6 percent near $0.1369 and $0.1284. These levels form a cluster often monitored during early wave recovery attempts. A sustained reaction from this region would help confirm whether a short-term upward push remains possible.
Risk of a Wider Corrective Move
Market conditions show that DOGE continues to trade inside a downward-sloping channel that formed after several weeks of corrective pressure. The move resembles a W-X-Y pattern where each segment contributed to a grinding decline. This pattern increases the possibility of a wider wave 2 development if bullish momentum fails to appear.
The previous bounce from the channel’s lower boundary in late November created a small recovery phase. Yet the price has repeatedly met resistance along the channel’s upper line. This behavior keeps the broader structure vulnerable, as the market has not confirmed any impulsive follow-through.
The analysis notes that failure to stabilize near the current Fibonacci range could open a move toward the deeper 78.6 percent level near $0.1157. Such a shift would indicate that the corrective phase is still expanding before any new directional trend begins.
Weekly Patterns and Broader Market Rhythm
The weekly DOGE chart introduces a different perspective built on repeating cycles of pumps followed by complex pullbacks. These cycles have appeared consistently since early 2024, showing multi-legged declines that reset market conditions before each new expansion.

These complex pullbacks form rounded structures, with overlapping movements that absorb selling pressure. After each pattern was completed, DOGE produced strong impulsive rallies that broke prior resistance zones. The chart illustrates these sequences with curved paths showing how the market transitioned from compression to expansion.
The current weekly structure mirrors earlier cycles as price action compresses inside a broad descending channel once again. This similarity suggests the market may be nearing another pivot phase where the cycle could shift if buyers regain control. Market participants now wait to see whether the repeat pattern continues or if DOGE extends the corrective structure further.


