
- Dogecoin slips below a major H4 triangle support, shifting the short-term structure to bearish momentum.
- Intraday trading shows a clear trend of lower highs and lower lows after losing the $0.145 level.
- Market data points to growing caution as traders watch support near $0.133–$0.135 for stability.
Dogecoin moves through widened volatility after slipping under a key technical structure on the four-hour chart. The market now trades near a lower band as sellers reinforce pressure and short-term support levels face renewed market testing.
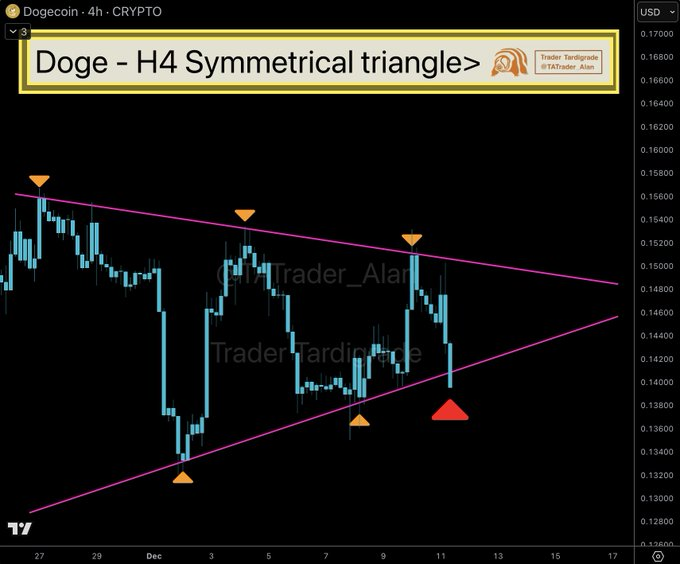
Breakdown From the H4 Symmetrical Triangle
Dogecoin begins the session with the Focus Keyword shaping market attention, as the asset falls below a visible H4 symmetrical triangle. The formation held for nearly two weeks and reflected tightening market behavior. However, the support trendline eventually failed as price slipped beneath the lower boundary.
The structure featured lower highs and higher lows while traders waited for directional clarity. The pattern’s compression phase marked reduced volatility before a sharper move developed. Once price pushed through the lower trendline, sellers gained short-term control and shifted the market tone. A notable candle break triggered the move as pressure spread across nearby price levels.
The move gains context from a post shared by Trader Tardigrade (@TATrader_Alan), who noted the breakdown as it formed. The break also places focus on potential lower zones near the $0.133–$0.135 area. This region sits close to liquidity tested early in the month and now emerges as a possible target.
Intraday Shift Toward Lower Price Levels
The 24-hour chart shows Dogecoin moving from the $0.147 area into a downward path. The intraday structure begins with a mild consolidation phase early in the cycle. Price then attempts a small upward push before meeting resistance and returning to a declining path.
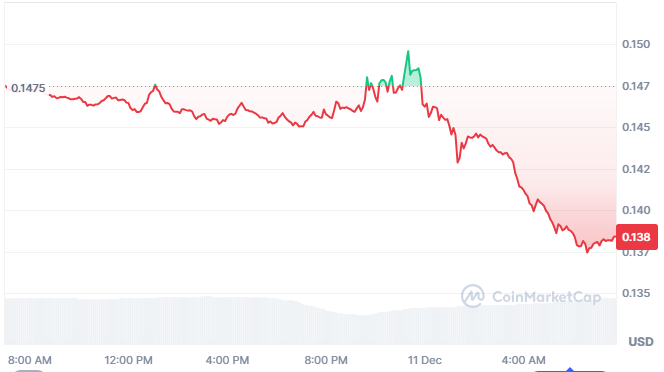
As the move develops, the $0.144–$0.145 range fails to stabilize the market. The loss of this level opens space for continued selling as a steady sequence of lower highs and lower lows forms. The market reacts to the earlier pattern break, shaping the latest decline.
The price now trades near $0.138, logging a daily decrease of more than 6%. Volume sits near $1.69B, reflecting active participation. The day’s progression suggests traders respond to prior structural breaks while evaluating whether current levels will hold.
Market Conditions and Key Levels Ahead
Market sentiment leans cautious as the market cap posts a 6% decrease. The broader structure now moves closer to ranges watched across multi-day charts. The earlier attempted bounce failed to reverse momentum, leaving little sign of an immediate turn. Traders continue watching for any movement back toward the $0.142–$0.145 area.
The social feed references retail activity and whale behavior, though no visible reaction occurs on the charts. The asset remains near the session low with no immediate recovery signals. The move reinforces the short-term bearish tone that formed after the break.
Dogecoin now approaches areas that could offer support if selling slows. Market participants assess reactions at these levels as the next sessions unfold. DOGE continues to guide market discussions as it tests deeper ranges.


