

- Total market cap forms a rare double cup-and-handle pattern pointing toward a $6.5T technical target.
- Bitcoin trades near $92,559 as liquidity rises and short-distance metrics suggest upward pressure.
- Crypto assets show tighter long-side stress zones, creating conditions for selective short squeezes.
The crypto market continues to show firm structural strength as Bitcoin’s steady performance aligns with a confirmed double cup-and-handle formation on the total market cap chart, signaling sustained momentum across major assets in the current cycle.
Macro Structure Builds Toward Multi-Trillion Setup
The broader trend gains traction as analyst Bitcoinsensus reports a completed double cup-and-handle formation on the total crypto market cap. The structure spans multiple cycles and shows a clear breakout with sustained support along the neckline. The earlier rounded base formed during the 2021 peak and 2022 downturn period now serves as a foundation for long-term continuation.
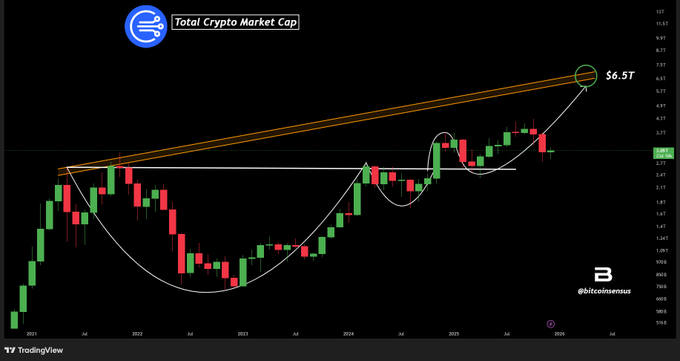
A second rounded base developed across 2024 and 2025, forming a smaller cup-and-handle pattern. This created layered structure rather than abrupt trend acceleration, suggesting controlled consolidation phases. Bitcoinsensus notes the rising trendlines that define the technical ceiling, placing the next major valuation zone at approximately $6.5 trillion.
Bitcoin’s Positioning Strengthens Amid Steady Liquidity
Bitcoin as of writing trades at $92,559 with a 24-hour gain of 2.46%. The market capitalization is 1.84 trillion with improved liquidity conditions. The trading volume increases by over 13%, which indicates a resurgence in the spot and derivatives markets. The current Volume-to-Market-Cap ratio of 3.51% signals balanced conditions without excessive speculative spikes.
Supply metrics remain unchanged with 19.96 million BTC in circulation. Market movement shows a sharp rise followed by stabilization as traders adjust positions. The early upward push may reflect short-term liquidations or macro-driven flows before cooling into equilibrium near the $1.84 trillion mark.
Derivatives Metrics Map Out Short-Term Pressure Zones
Short and long max pain levels across major assets offer a view of where traders face the greatest stress. Bitcoin’s short max pain sits above market price with a 3.13% gap, pointing toward potential upward pressure if the market moves into that zone. Long-side distances remain tighter, with BTC at –0.87%, reflecting sensitivity on that side.
Ethereum, Solana, XRP, DOGE, and BNB show similar patterns, with green short-distance readings and negative long-distance values. Solana shows the widest short-distance range, creating conditions that could trigger a squeeze if buying accelerates. ADA shows the tightest long-side range at –9.14$%, marking elevated stress for leveraged long positions.


