
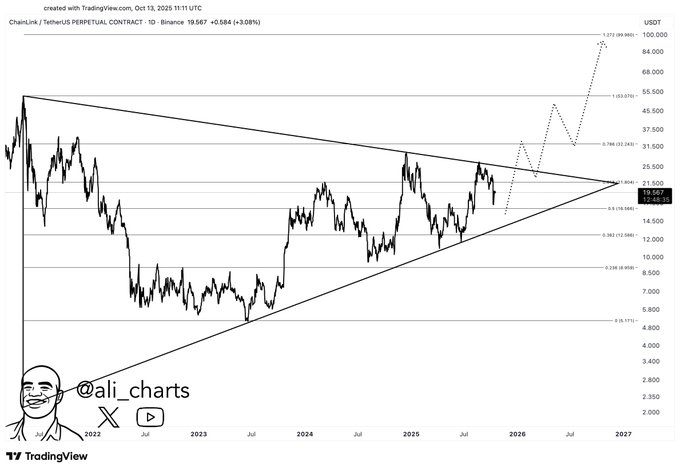
- Chainlink is a long term symmetrical triangle that leads to a possible break out of multi-year steady consolidation in the bullish direction.
- Trading volume and sentiment remain constructive, suggesting accumulation near key support around $18.20.
- Analysts project upside targets of $45, $68, and $100 if Chainlink breaks above structural resistance near $23.
Chainlink is still in a long-term technical setup with investors watching its price action around vital support. Market sentiment remains cautiously optimistic amid expectations of a major directional shift once volatility contracts further.

Chainlink’s Structural Setup Signals Market Compression
Chainlink’s chart displays one of the most stable large-cap formations in the market. According to technical observations, the asset has been consolidating inside a massive symmetrical triangle pattern since mid-2021, reflecting a prolonged period of accumulation. This structure has historically preceded strong breakouts once volatility tightens near the apex.
Crypto analyst Ali recently shared an updated outlook on X, noting that “Chainlink ($LINK) remains in the buy zone before the bull rally to $100.” His chart illustrates how $LINK continues to trade near the triangle’s lower boundary, which has acted as consistent support since June 2022. The declining trendline up to now, however, keeps capping rallies indicating that the price compression could be on its way out.
Chainlink currently trades at approximately $18.58, with a 4.63% fall over the last 24 hours. This action is in contrast to an intraday turnaround at highs of up to $19.90, where the token is now probing the demand zone of between $18.20 and $18.50. Traders are monitoring whether this level to ascertain continued accumulation instead of structural disillusionment.
Fibonacci Levels and Analyst Targets Outline the Next Move
Ali’s analysis places emphasis on Fibonacci confluence levels that align closely with key resistance zones. The first technical obstacles are the 0.5 retracement close to the price of $14.50 and the 0.618 level close to the price of $23.00. An upbreak and daily close above 23.00 would indicate the end of the accumulation phase and would be the indication that the new expansion cycle is underway.
The projected bullish scenario points to intermediate resistance around $30–$35, where a short-term consolidation could occur before continuation. Beyond that zone, the 1.272 Fibonacci extension projects a long-term target near $100 — a move that would represent a substantial gain from current price levels.
Ali’s chart also implies a classic retest scenario. Should a breakout occur, a brief pullback to confirm the breakout area could follow before the next upward leg begins. This pattern has characterized several of Chainlink’s historical cycles, where extended compression phases were followed by rapid directional moves once key resistance levels were cleared.
Market Dynamics and Sentiment Show Underlying Strength
Chainlink sentiment is generally positive even though it is experiencing a short-term decline at the time of writing. According to market data of CoinMarketCap, 86% of the traders are confident because they have bullish votes. The market capitalization of the asset is $12.6 billion with a 24-hour trading amount of $1.47 billion – an increase of 9.91% compared to the last trading session.
Meanwhile, crypto commentator s.cape.1 hared on X that “$KAS was not the only crypto to be severely manipulated in its early days. Look at $LINK in 2020.” The post recalls Chainlink’s earlier price behavior, marked by sharp volatility before long-term structural rallies, suggesting that the token’s current pattern could mirror similar cyclical dynamics.
From a supply standpoint, 678.09 million LINK tokens are in circulation out of a total 1 billion, keeping inflation low. The Fully Diluted Valuation (FDV) of $18.58 billion is still very close to the market cap, and this shows that there is no volatility in the distribution of tokens. The traders also keep an eye on the $18.20 support as a short term inflexion point, maintaining the support above the level may once again generate momentum towards the $19.80 and possibly the zone of the breakout of the high of $23.
Chainlink’s long-term technical base remains active as the compression is approaching completion. Short-term volatility is likely, but there is a continued build-up and high volume trading indicates that the market participants are well-positioned to handle a continuation phase when the wider crypto environment stabilizes.


