
- Chainlink retests a vital support zone while intraday volatility shapes near-term sentiment across major trading platforms.
- Mixed performance data shows short-term strength but broader weakness after extended monthly and quarterly declines.
- Long ratios across top exchanges rise sharply, revealing strong trader confidence yet increased squeeze vulnerability.
Chainlink moves around a crucial support zone as traders assess mixed performance data and shifting long positions. Market participants track volatile intraday swings while evaluating whether current structure can sustain a near-term recovery phase.
Chainlink Retests Support Amid Volatile Trading Conditions
Chainlink is retesting a horizontal support band after a sharp rejection from a short-term downtrend line. The $15.0–$15.2 region continues acting as a pivotal structural area after previously serving as resistance. Price action across lower time frames shows repeated touches within this zone, signaling active participation from buyers defending the level.
An update from Alpha Crypto Signal referred to the retest as a critical moment for market structure. According to the post, holding above the zone keeps the setup intact for possible movement toward $15.7–$16.0. The commentary notes that a breakdown below the area may open room for deeper downside movement as structural support weakens. The post also stresses the role of the 9 EMA, which remains an important guide for the micro-trend.
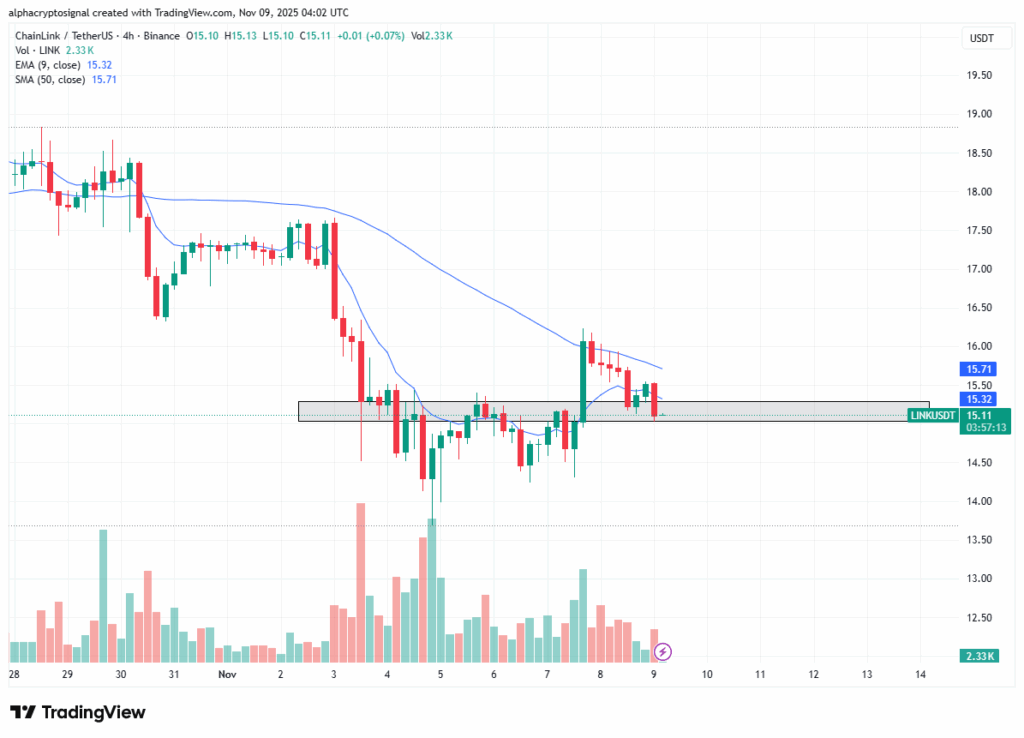
Price remains within a volatile intraday range between $15.1 and $15.6. Sudden spikes toward the session highs signal renewed buyer interest after several downward wicks tested liquidity. The price of Chainlink as of writing, stands at $15.54, with the past 24 hours showing a slight decline of -0.09% and a 7-day decline of -11.11%.
Performance Metrics Reveal Mixed Short-Term and Mid-Term Signals
Performance readings show contrasting trends across time frames. The 4-hour data presents a +1.34% move, reflecting a modest recovery phase. This movement aligns with the latest V-shaped pattern visible in shorter-term charts and suggests a degree of momentum returning to the market.
The daily reading sits at -0.25%, marking subdued sentiment over a broader window. Meanwhile, the 7-day metric records a -9.16% shift, revealing persistent pressure related to extended sell-side activity. The 30-day figure drops by -29.34%, and the 90-day figure by -29.63%, reflecting sustained retracement phases across monthly segments.
The 180-day performance sits at -7.04%, showing partial stabilization across mid-year conditions. Long-term metrics remain stronger: the 1-year reading holds at +13.38%, and the lifetime reading stands at +9.83K%. These numbers indicate structural durability across wider market cycles.
Trader Positioning Shows Strong Long Bias Across Exchanges
Long and short ratios reveal a market leaning heavily toward bullish positioning. Binance’s LINK/USDT long-short ratio sits at 2.1696, marking a strong preference for long exposure. Top traders on the exchange show even stronger conviction with a ratio of 2.6443, reflecting large directional positioning.
OKX traders follow a similar pattern with a ratio of 1.85. Broad alignment across multiple platforms suggests that market participants expect continuation from recent recovery attempts. Such elevated ratios often indicate strong directional sentiment during retest phases.
This trend reflects a market preparing for potential upside continuation. However, heavy long exposure may also increase sensitivity to sudden downside pressure if the support zone weakens. Traders therefore monitor the $15.0–$15.2 region closely as near-term liquidity continues shaping price direction.


