
- Chainlink forms a TD buy signal after extended selling and narrowing intraday ranges near key support levels.
- Derivatives activity shows rising volume and declining open interest, pointing to rotation in short-term positioning.
- Long positioning grows on major exchanges while liquidations show pressure on leveraged bullish traders.
Chainlink shows a shift in short-term structure as it forms a TD buy setup while derivatives data indicate rising activity and mixed positioning. The market reacts to a period of selling that creates compressed ranges and heightened volatility.
TD Signal Marks Exhaustion in the Recent Decline
Chainlink printed a TD buy signal on the 30-minute chart after a steady sequence of lower closes. The setup formed as the ninth candle completed the standard TD downcount pattern. The candle displayed a long lower wick that showed rejection of deeper selling attempts.
The chart shared by Ali (@ali_charts) shows LINK reaching the end of a multi-session decline. Candle bodies had been shrinking ahead of the signal, showing a slowdown in momentum. The lower wick on the ninth candle suggests absorption of selling near the $12.20-$12.50 area.
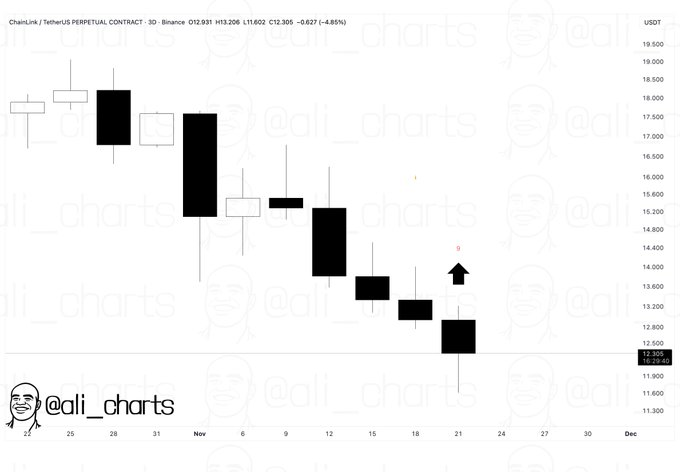
The TD signal forms as the downtrend begins to compress. Candle ranges tightened before the sequence completed, creating conditions that support short-term relief moves. LINK’s reaction to intraday support levels in prior sessions aligns with the TD exhaustion pattern.
Derivatives Metrics Show Rising Volume and Lower Open Interest
Derivatives volume for LINK climbed more than 10% to $940.21M, reflecting stronger activity during the latest selling phase. This rise occurred while open interest fell 1.33% to $522.26M. The combination points to rotation as traders closed and reopened positions during rapid moves.
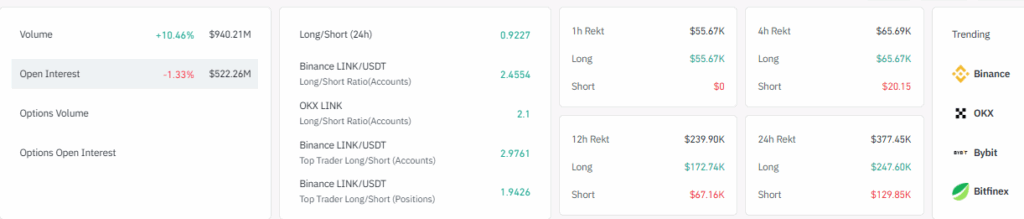
Options metrics were listed without values on the dashboard, placing the focus on perpetual and futures markets. Activity concentrated primarily in linear markets during the recent volatility cycle. The data shows traders adjusting exposure rather than expanding leveraged commitments.
Exchange positioning reveals mixed sentiment. The long-short ratio has been aggregated to $0.9227, with a slight bias on the shorts. However, major venues show a different picture. Binance and OKX post long-leaning ratios, and top Binance traders maintain strong long exposure across accounts and positions.
Liquidation Data Shows Pressure on Leveraged Longs
Liquidations during the period show short-term price pressure on bullish positions. The 1-hour window recorded $55.67K in long liquidations as LINK moved lower. The 4-hour data shows $20.15K in short liquidations, indicating a brief upward move.
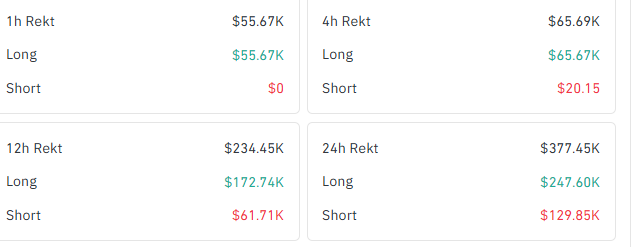
The 12-hour window recorded $239.90K in total liquidations, most of them from long positions. This marks a period of heavier selling earlier in the cycle. The 24-hour data shows $247.60K in long liquidations, signaling continued pressure on leveraged longs.
Chainlink’s derivatives landscape shows rising activity, selective deleveraging, and bullish positioning on major exchanges. LINK trades near short-term support as the TD buy signal forms during a phase of increased volatility.


