
- CAKE deflation reached 36 months as August burns exceeded issuance by more than two million tokens during the latest month reported.
- PancakeSwap has removed nearly 59.7 million CAKE from peak supply while the daily chart maintains a rising channel structure after August.
- CAKE trades near $2.16 after pulling back from above $2.40, with channel support now guiding the next technical test for buyers now.
CAKE deflation enters a new market phase as three years of supply contraction meet a rising daily channel, with recent selling bringing price toward dynamic support.
Three Years of Sustained Supply Contraction
PancakeSwap’s price of pancakes dropped by 36 consecutive months, reaching August 2026. The streak started in September of 2023 and has been ongoing. Overall, the amount of tokens burned has always been greater than the amount of CAKE that were issued during those months.
August extended that pattern with 2.75 million CAKE burned during the month. Only 674,316 CAKE were generated during the same period. The resulting supply reduction exceeded two million tokens in August.
The latest figures place cumulative reductions near 59.7 million CAKE from peak supply. That figure reflects repeated monthly burns rather than one isolated event. It also provides context for the latest contraction recorded by PancakeSwap.
The BSCN report places CAKE deflation at the center of the milestone. Its accompanying visual shows CAKE trading near $2.16 after a recent decline. The chart also places price inside a broader rising technical structure.
Price Advances Within a Rising Channel
The daily chart depicts CAKE consolidating in a rising channel from around $1.40. Price moved through $1.60, $1.80, and $2.00 during the recovery. The bulls eventually got the better of the advance which had closed at a tad more than $2.40, and drove the price down.

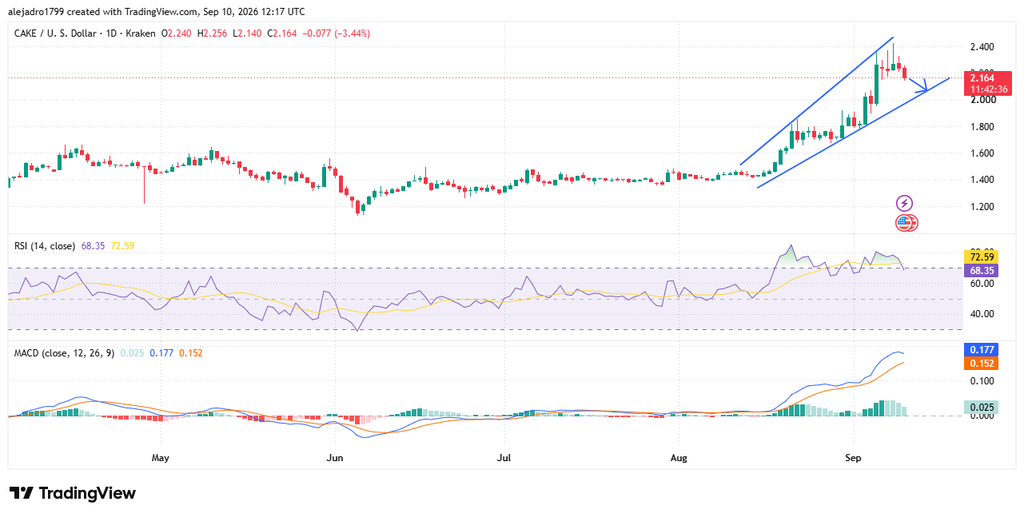
That retreat has brought CAKE back toward the channel’s lower trendline. The lower boundary has supported several stages of the recent upward structure. Holding that area would keep the displayed channel intact.
Near-term resistance appears around $2.25 following the latest pullback. The recent peak above $2.40 remains the clearest resistance visible. A recovery toward that region would require price to regain lost ground.
The latest candles show sellers gaining control after the recent high. However, price remains above several earlier breakout areas on the chart. That keeps the rising channel as the main technical reference.
Momentum Remains Elevated Despite the Pullback
Momentum readings remain elevated despite the latest decline. The RSI stands at 68.02, while its moving average is near 72.57. Both readings reflect strong momentum following the recent advance.
The MACD also remains positioned above its signal line. The displayed MACD reads 0.177 against a signal value of 0.152. Its positive histogram, near 0.025, shows momentum remains positive.
At the same time, recent candles show reduced upward momentum. RSI has retreated from higher levels reached during the advance. The MACD histogram has also moderated as price moved away from its peak.
The chart therefore places the lower channel boundary at the center of current price action. A sustained break beneath that trendline would weaken the rising structure. Previous consolidation areas could then become relevant reference points.