

- Whale shorting on BNB has outpaced retail positions, signaling increased volatility and weaker buy conviction from larger players.
- BNB’s buy/sell pressure delta shows sharp hourly reversals, highlighting an active tug-of-war between short-term bulls and bears.
- Despite pressure shifts and whale skepticism, BNB holds firm above $540 support, reflecting strong structural resilience.
Binance Coin (BNB) is drawing heightened attention from whales as recent data shows disproportionate shorting activity compared to retail traders. Buy pressure has noticeably weakened, triggering sharp short-term volatility and exposing BNB to rapid sentiment reversals.
Whale vs Retail Behavior Signals Price Sensitivity
According to a post by Alphractal, whale behavior has diverged from retail sentiment, particularly for BNB. The Whale vs Retail Ratio chart from May 5 to May 22, using hourly snapshots, shows that institutional trades have favored short positions. BNB’s price fluctuated between $558 and $578 during this time, under downward pressure early in May and entering consolidation after May 12.
The blue line plotting the Whale vs Retail Ratio consistently hovered below 1.0, indicating a lack of whale dominance. A brief spike around May 9 suggested increased whale involvement, but it faded quickly. From May 17 to May 22, BNB and other top tokens reflected retail-led activity with ratios staying well below the 1.6 mark across the board.
Buy/Sell Pressure Delta Reveals Tug-of-War Dynamics
Pressure dynamics for BNB show significant fluctuations across one-hour intervals, revealing sharp reversals between buying and selling waves. Buy pressure, currently recorded at 0.466, trails behind sell pressure at 0.689, with a pressure delta of 16.725 in favor of sellers. Visualizations show red-dominated zones from March 30 to April 6, marking strong sell phases and declining prices.
Buy pressure resurged mid-April, lifting BNB above structural support and triggering recovery. Alternating trends followed through April 20, eventually giving way to a dominant green zone from late April to May 5. Pressure delta swings above 40 during this period confirmed renewed accumulation strength in $BNB.
Volatility Rises as Support Levels Hold Despite Sell Zones
After peaking in early May, BNB buy zones moderated but remained visible even during recent volatility. Between May 20 and May 22, minor sell zones reappeared, although the price remained above $580. Volume-driven red and green shifts aligned with candlestick overlays, confirming pressure delta’s reliability for short-term directional cues.
Price levels consistently respected support zones above $540, with no extended negative delta sequences since April. Positive delta periods continued supporting bullish structure despite whale skepticism. Pressure trends reinforce that BNB remains in a rhythmical liquidity loop, oscillating between profit-taking and reaccumulation phases.
BNB Market Metrics Reflect Strong Underlying Structure
BNB’s current price stands at $671.27, marking an 11.49% monthly gain. According to data from CoinMarketCap, the token holds a market capitalization of $94.57 billion, despite a 1.76% contraction in valuation. The 24-hour trading volume sits at $1.93 billion, with a liquidity indicator at 2.04%, signaling healthy market activity.
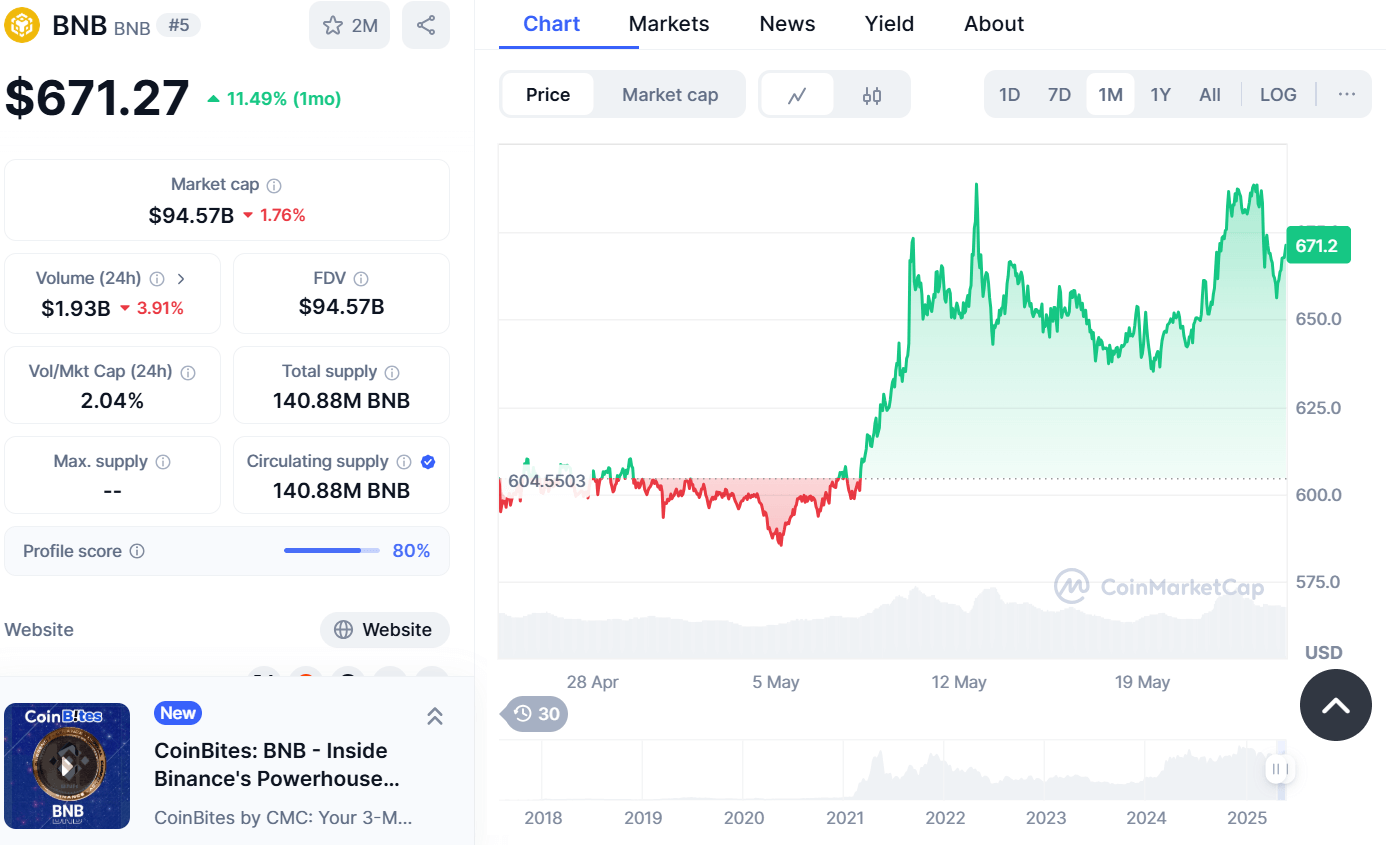
The circulating supply of 140.88 million BNB mirrors the total supply, with no cap defined for maximum issuance. The price trend has steadily risen since late April, beginning from $604.55 and peaking near $671.2. Despite pressure shifts and short-term whale-retail imbalance, structural support remains intact, underlining resilience.


