

- Corporate entities acquired 196,207 BTC in 2025, over three times the newly mined 60,044 BTC supply.
- Bitcoin ETFs saw $319.5M inflows on May 14, led by IBIT with $232.9M, signaling strong institutional demand.
- Centralized exchanges lost 97,000 BTC in withdrawals from March to May, indicating a long-term holding trend.
According to a post by TheCryptoBasic, corporate entities have acquired 196,207 BTC so far in 2025, more than tripling the year’s newly mined supply of 60,044 BTC. The 136,163 BTC discrepancy marks an aggressive expansion of balance sheets at a time of reduced issuance following the April 2024 halving.

The halving cut daily block rewards from 6.25 BTC to 3.125 BTC, reducing daily supply to roughly 450 BTC. Even with mining difficulty adjustments and relatively stable hash rate fluctuations, this limited output has failed to meet institutional demand. Corporations are now absorbing more than 76% of new Bitcoin mined, with little evidence of liquidation activity.
ETF Inflows Reinforce Institutional Appetite
Simultaneously, other market indicators suggest a different trend, reinforcing this supply pressure. Bitcoin ETFs recorded $319.5 million in net inflows on May 14, led by IBIT at $232.9 million. FBTC and GBTC followed with inflows of $36.1 million and $35.2 million, respectively.
This capped two weeks of volatile, yet predominantly positive flow data. On May 2, IBIT posted a solo inflow of $674.9 million, the highest of the period. Across multiple days, net inflows remained above $250 million, reflecting steady institutional demand despite minor outflows from GBTC and ARKB.
BTC Outflows Tighten Supply as Thin Liquidity Zones Fuel Volatility
Between March 22 and May 12, over 97,000 BTC exited centralized exchanges, reducing balances from 3.11 million to 3.013 million as Bitcoin climbed from $86,000 to over $105,000. The steepest outflow occurred in May, with 60,000 BTC withdrawn in 10 days, each aligned with upward price action, suggesting accumulation into cold storage. Meanwhile, Binance’s perpetual futures order book shows Bitcoin trapped between dense bids near $100,000 and resistance at $107,800. Thin liquidity from $102,000 to $104,000 now threatens sharp price swings as traders navigate a tightly split market.
Technical Indicators Hold Bullish Bias Despite Pullback
Bitcoin’s daily chart as of May 15 reflects a minor -1.15% pullback to $102,336, with the RSI cooling from its recent peak of 68.96 to 64.84. The MACD remains in bullish crossover territory, with the MACD line at 3,860 above the signal at 3,742 and a histogram of 118.
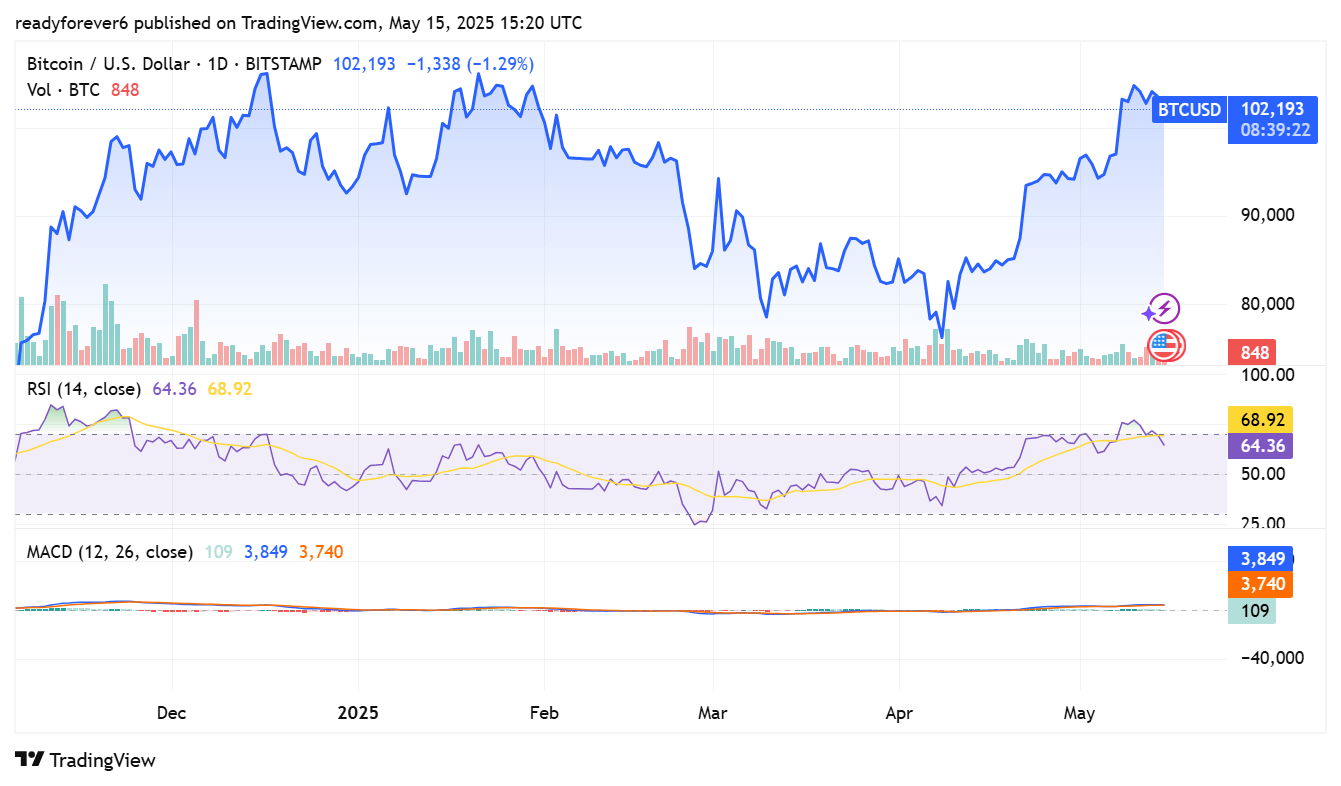
Price action continues to hold a series of higher lows since April’s breakout, which saw BTC rally from below $90,000 to above $100,000. Despite the dip, both RSI and MACD readings suggest the bullish trend remains intact with no immediate breakdown signals.


