

- Binance’s BTC reserves plunged over 70K since October, as Bitcoin surged 73%, signaling rising pressure on available supply.
- Despite hitting new highs, Bitcoin’s MVRV Z-Score remains under 3, suggesting room for growth without signs of market euphoria.
- On-chain data shows investors pulling BTC from exchanges into cold storage, reinforcing long-term holding behavior.
Bitcoin supply on Binance has fallen by over 70,000 BTC since October 2024, triggering renewed discussion of a potential supply crunch. This decline coincides with a 73% price increase, marking a sharp divergence between on-exchange reserves and market valuation.
According to a post by Mister Crypto, the chart sourced from CryptoQuant illustrates Bitcoin’s USD price (white line) against Binance’s BTC reserve (blue line) from July 2024 through May 2025. The reserve began at roughly 569.9K BTC in July, peaked at 635K BTC in September, and began an extended downtrend in October. By May 2025, reserve levels had dropped to nearly 560K BTC, a level not seen in over a year.
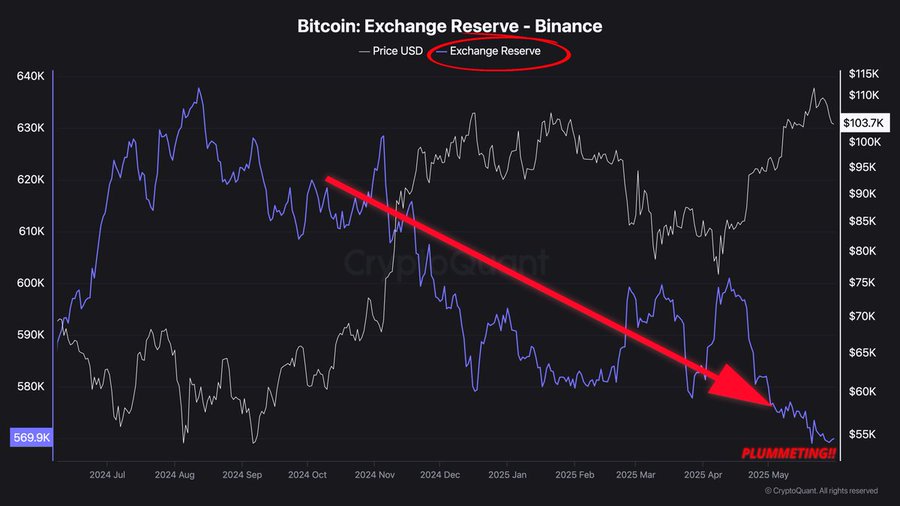
Each brief rebound in reserves between December 2024 and February 2025 was followed by sharper drawdowns. These local upticks, often misread as accumulation, reversed swiftly, confirming sustained exchange outflows. Visual emphasis, including a bold “PLUMMETING!” label on the chart, underscores the speed and severity of BTC withdrawals from Binance.
Price Accelerates as Exchange Reserves Collapse
Bitcoin’s price rose steadily during this period, beginning at under $60,000 in October 2024 and reaching $103,731 by May 2025. Notably, its April peak surpassed $110K before a minor correction, suggesting the market responded to tightening exchange liquidity.
This inverse correlation is highlighted by the chart’s divergence between the falling reserve line and accelerating price. As the reserve fell below 580K BTC, price momentum steepened, revealing supply constraints’ growing influence on bullish price action. The dual Y-axis chart confirms this with synchronized divergence.
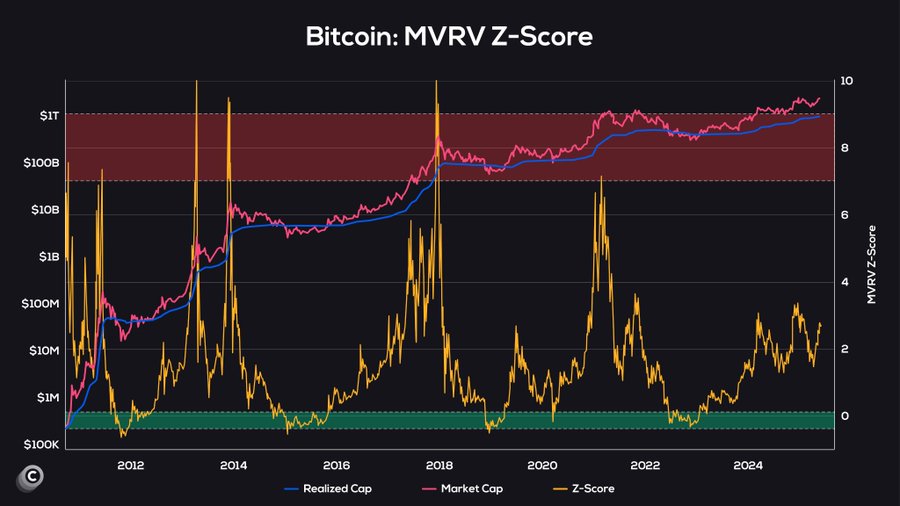
Bitcoin remains undervalued despite new all-time highs, according to the MVRV Z-Score chart, a key macro signal. The chart tracks Bitcoin’s market cap, realized cap, and Z-Score from 2011 to mid-2025. As of May 2025, the Z-Score has climbed above 2 but remains well under historical euphoria levels above 7.
The MVRV Z-Score indicates Bitcoin is not overextended. The market cap is nearing $1 trillion while realized cap hovers near $500 billion. This dynamic keeps the Z-Score low, historically signaling room for further upside based on long-term capital flows.
On-Chain Signals and Sentiment Support Bullish Outlook
Throughout the reserve decline, on-chain data has reflected strengthening investor conviction. Exchange outflows typically suggest increasing cold wallet storage, a behavior consistent with long-term holding. The uninterrupted drop in reserves further affirms that no major accumulation reversal is underway.
At the time of writing, the Bitcoin Fear and Greed Index holds steady at 50, indicating a neutral sentiment baseline. BTC is currently fluctuating between $103,731 and $104,577, reflecting consolidation near recent highs.
Analysts broadly interpret the recent price dip as a shakeout, not a reversal. Structural metrics remain bullish, with multiple analysts targeting $120,000 and some projecting longer-term valuations up to $1 million. Rising active wallet counts and accelerating outflows are cited as critical on-chain bullish catalysts.


