

- BTC ETFs added $127.53M in April inflows as iShares led with 25,430 BTC.
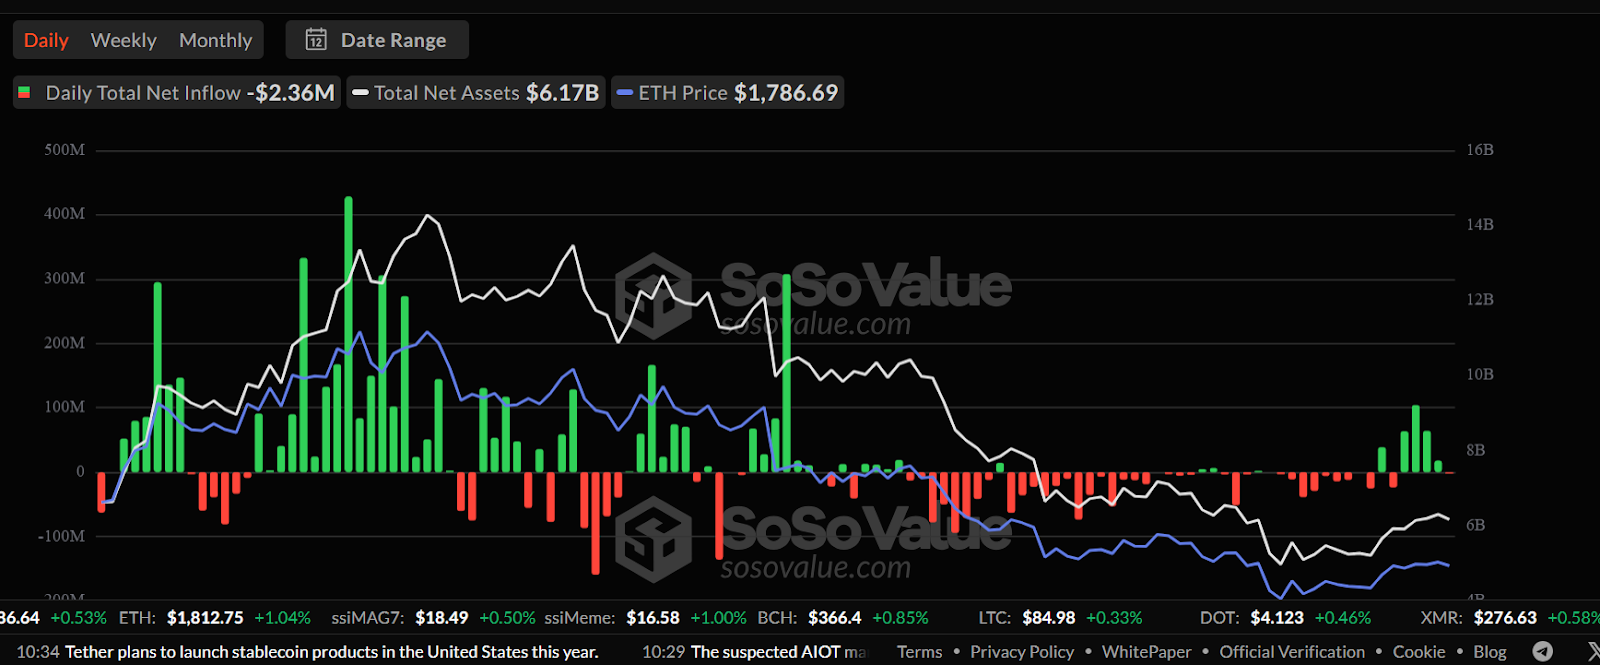
- ETH ETFs lost $2.36M daily as total net assets dropped below $ 6.2 B.
- BTC price gains aligned with ETF inflows, while ETH faced prolonged outflows.
Spot Bitcoin and Ethereum ETFs showed contrasting capital movement as April closed, exposing key market sentiment shifts. BTC ETFs saw mixed activity with $127.53M in inflows, while ETH ETFs posted $2.36M in net outflows.
BTC ETFs Post Inflows Despite Final-Day Drop
U.S.-listed spot Bitcoin ETFs collectively held 1,153,832 BTC as of April 30, valued at $109.48 billion. The largest holder, iShares by BlackRock, recorded a 1-day inflow of 2,273 BTC and a 7-day net gain of 25,430 BTC. In Lookonchain’s ETFs update, the firm noted a total daily net inflow of 1,366 BTC worth $127.53 million.
Other ETF players showed mixed flows across the same period. Fidelity’s FBTC saw a one-day outflow of 65 BTC but gained 1,484 BTC over the week. ARK 21Shares dropped 140 BTC in 24 hours but ended with a weekly net gain of 14 BTC.
Despite these movements, April’s momentum remained intact for BTC ETFs. From mid-April, steady green bars on the capital flow chart highlighted robust investor confidence. Net assets climbed from under $90 billion to $108.58 billion by April 30, supported by a rising BTC price that hit $94,152.01.
ETH ETF Holdings Contract as Outflows Persist
Ethereum ETFs tracked a more cautious tone with reduced investor activity and lower capital inflows. According to data from Sosovalue, daily net outflows reached $2.36 million while total net assets settled at $6.17 billion. Fidelity’s FETH led inflows with 13,988 ETH in one day and a 7-day addition of 33,972 ETH.
In contrast, Grayscale’s ETHE lost 79 ETH in a single day and 4,295 ETH over the week. ETH price sat at $1,786.69, trailing its earlier highs, while ETH ETF holdings totaled 3,461,757 ETH. Grayscale Ethereum Mini Trust gained 19,579 ETH for the week but remained under pressure from wider sell-offs.

Stakeholders are also evaluating broader implications for Ethereum-based fund exposure. Market conditions have prompted a new wave of strategies as red bars still dominate ETH flow charts. Net assets have declined sharply from the mid-period peak of over $14 billion to current levels.
Capital Movement Confirms Price Correlation Trends
The divergence in BTC and ETH ETF flows continues to affirm strong capital-price alignment. Bitcoin’s rising inflows correspond with increased price activity and investor reallocation. In April, several consecutive inflow days exceeded $500 million, confirming renewed market optimism.
ETH, by contrast, still reflects sustained outflows dating back months. Although recent green bars signal limited recovery, capital flight remains a central concern. Investors remain cautious, especially as Ethereum ETFs struggle to regain prior valuation highs.