

- Bitcoin ETFs show mixed flows, yet BTC price climbs on strong mid-April demand.
- ETH ETFs see selective inflows, hinting at cautious but growing interest.
- BTC and ETH charts reflect strategic buys as institutions eye long-term gains.
Despite net outflows from major Bitcoin and Ethereum ETFs, the prices of both digital assets saw strong upward momentum as of May 1, 2025. New data from Lookonchain and SosoValue suggest diverging institutional behavior across crypto-linked financial products, raising questions about underlying market drivers.
Bitcoin ETF Outflows Continue Despite Price Climb
On May 1, ten spot Bitcoin ETFs recorded a combined net outflow of 382 BTC, equivalent to $36.68 million, reflecting a pause in institutional accumulation. The Fidelity Wise Origin Bitcoin Fund (FBTC) alone saw 1,462 BTC in outflows, $140.57 million in capital, even as it remains one of the largest holders with 198,376 BTC valued at $19.07 billion. This marks a rare divergence between spot price action and ETF demand.
Despite the daily outflow, the seven-day net flow into Bitcoin ETFs remained positive at 16,857 BTC or $1.62 billion. IBIT (BlackRock) led the inflow trend with 2,841 BTC daily and over 21,000 BTC across the week, reinforcing its market dominance with 604,049 BTC under management. ARKB and BITB posted smaller but notable outflows, suggesting uneven sentiment across issuers.
SosoValue Data Confirms Accumulation Trend Amid Mixed Flows
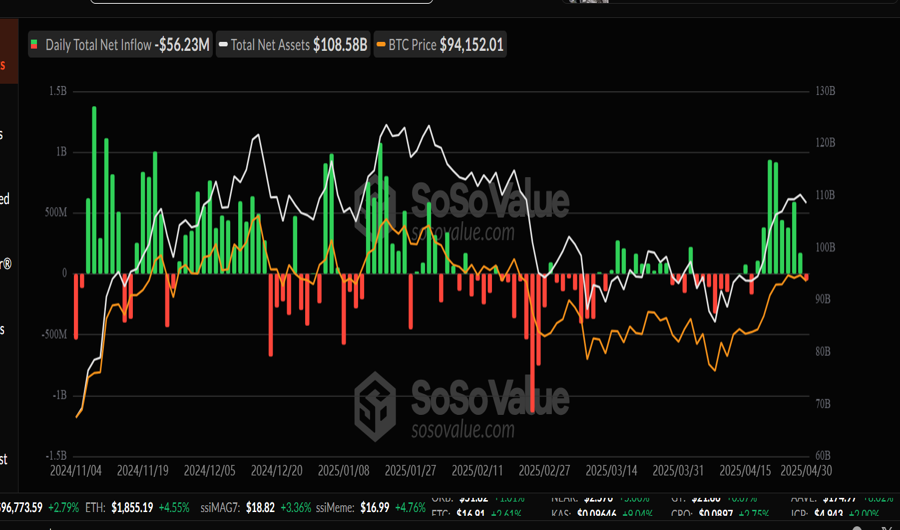
The total net assets held by Bitcoin ETFs have climbed to $108.58 billion, mirroring Bitcoin’s price surge above $94,000. Data from SosoValue on BTC ETFs shows a consistent rise in asset values and steady inflows throughout April. Notably, during mid-month, daily inflows exceeded $500 million for five straight sessions, highlighting a strong wave of institutional accumulation.
Structurally, the ETFs show diverse custodial and risk exposure frameworks: IBIT and FBTC hold assets with distinct liquidity profiles, while HODL and BRRR pursue more tactical allocations. The strategic objective appears increasingly tilted toward volatility timing, as institutional participants distribute into strength and re-accumulate on weakness, driving synchronized but not linear capital rotation.
Ethereum ETF Outflows Mirror Caution Despite Broader Recovery
Ethereum ETF products also posted outflows, with 1,648 ETH ($3.03M) exiting on May 1, largely driven by a 3,987 ETH outflow from Grayscale’s ETHE. The firm’s holdings still stand at over 1.14 million ETH worth $2.1 billion, making it the second-largest Ethereum ETF by assets. Meanwhile, FETH (Fidelity) saw modest daily inflows of 3,247 ETH, suggesting selective institutional interest.
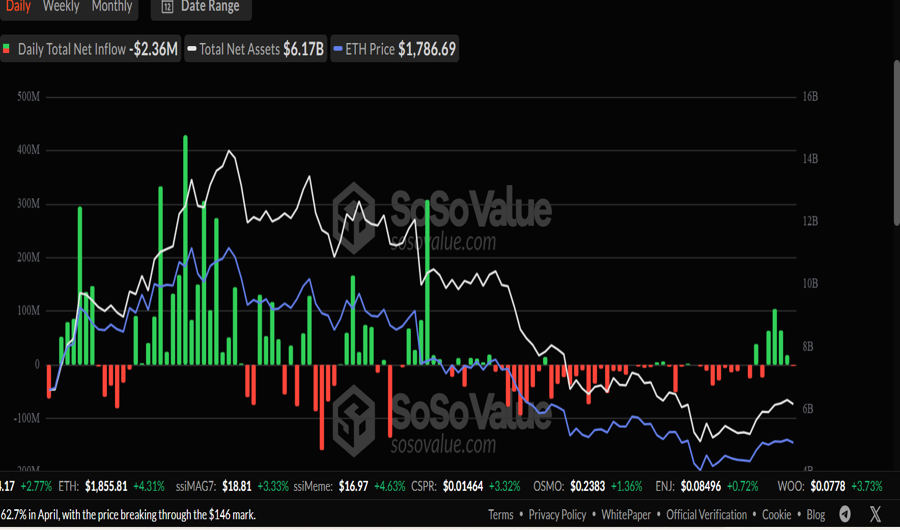
The seven-day flow for ETH ETFs paints a more optimistic picture, totaling 145,169 ETH ($226.67M) in inflows, led by ETHA (BlackRock) with 90,513 ETH and ETH (Grayscale Mini) with 19,579 ETH. Nevertheless, the total ETH ETF market shrank to $6.17 billion in assets under management from prior highs above $14 billion, revealing still-fragile sentiment in Ethereum exposure.
Technical Charts Suggest Strategic Accumulation at Key Zones
BTC’s chart shows price rebounding from sub-$85,000 to $94,152.01, supported by ETF flows and broader risk-on sentiment. Daily green bars in April’s second half reflect strong demand coinciding with price lifts, while net assets grew from $100B to over $108B, indicating aggressive accumulation. The sharp Q1 outflows now appear as a consolidation phase preceding breakout behavior.
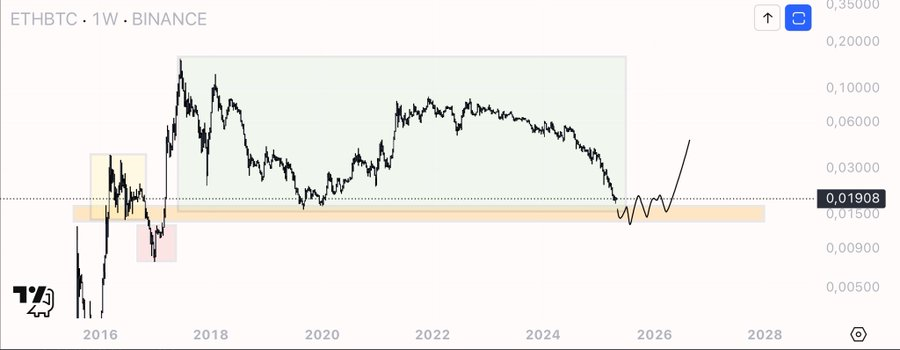
ETH’s technicals are more subdued, trading near $1,786.69 with the ETH/BTC pair at 0.01908, just above long-term support between 0.015 and 0.020. Historical behavior in this zone (2016, 2019, 2020) suggests ETH may be bottoming versus BTC. If the pattern holds, ETH could re-rate toward 0.030 by mid-2026, positioning the current phase as a strategic accumulation window for long-term holders.


