
- Avalanche trades near $30.57 as RSI and MACD confirm bullish strength, positioning for a breakout above resistance.
- Technical analyst CryptoBullet sees a massive bull flag pattern, projecting potential targets in the $120–$140 range.
- Short-term breakout above $31 may open the path to $33–34, supported by rising trendline and growing market activity.
Avalanche (AVAX) is trading within a powerful technical setup that has caught the attention of analysts. Current data shows the asset consolidating near a critical support zone while key indicators suggest momentum is turning in favor of bulls.
Bull Flag Pattern and Elliott Wave Structure
Analyst CryptoBullet (@CryptoBullet1) described AVAX as “absolutely ready” on the monthly chart, citing both a bullish RSI breakout and a MACD cross. The token is currently forming a large bull flag pattern, often regarded as a continuation structure in strong uptrends.
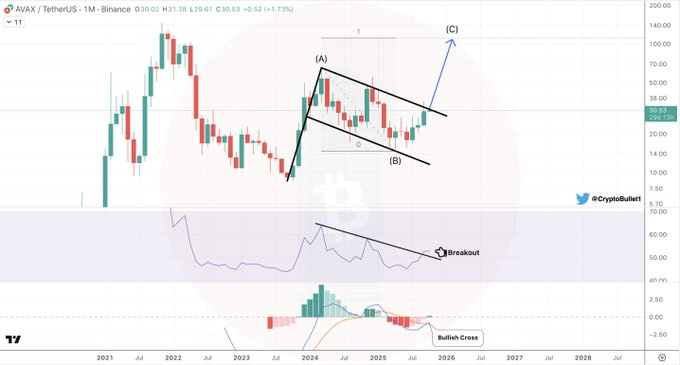
This formation has unfolded since the sharp rally in late 2023, labeled wave (A), followed by a corrective pullback forming wave (B). Now, price action is tightening inside the descending channel, reducing volatility before the next expansion. A breakout above the upper channel boundary could confirm wave (C), signaling a continuation of the bullish sequence.
Projections from the flagpole length indicate potential for price discovery far beyond current levels. Analysts see the $120–$140 area as a logical zone, supported by Fibonacci extensions and structural chart analysis. This provides long-term traders with a reference for possible upside once momentum confirms.
RSI Breakout and Momentum Indicators
Momentum indicators reinforce the bullish technical setup.Relative Strength Index (RSI) broke out over a downward resistance line that had been drawn since early 2024. This kind of breakout on a monthly basis is usually the precursor to multiple-month rallies in the key assets.
This development signals that selling exhaustion may have concluded, with accumulation phases likely underway. The reset in momentum has historically provided fuel for new cycles in digital assets, and AVAX now appears to be aligning with this trend.
The Moving Average Convergence Divergence (MACD) indicator also adds strength to this case. A bullish cross has formed near the zero baseline, a position that usually carries greater weight than crosses made in extended zones. The histogram turning green confirms building buying pressure across higher timeframes.
Near-Term Market Structure and Targets
AVAX is as of writing, trading at $30.57 on the daily chart with a 0.86 percent drop in 24 hours. Nonetheless, the market value is strong at $12.9 billion with the volume of trade increasing over 15 percent to 1.4billion. This indicates strong liquidity and active participation from traders.
The analysis notes that price broke out from a wedge formation and successfully retested the move. AVAX is now pressing against short-term resistance just below $31, while still being supported by an upward trendline. It is essential to the bulls to maintain the $30 base to ensure control.
The push that is proven to be above $31 may start the second leg of the rally to the range of $33-$34. In the event the bull flag verifies on extended intervals, there are extended objectives over $100. However, a rejection at current levels may extend consolidation, exposing supports closer to $20.


